

We still have a strategy that we stick to — for the second year in a row, we finish the year in first place among companies. There’s no recipe or secret ingredient here — just daily work that yields results. Like in the gym, when you don’t slack off.
Under the cut — we analyze the blog's activity over the past 4 years.
All calculations in this publication are based on the analysis of a CSV file containing information about all blog posts, which can be exported from the corporate blog management panel — thanks to Habr for providing this opportunity.
Blog on Habr
Here we could simply write down the numbers, but it’s much nicer to compare them with the numbers from previous periods. Considering that we've been maintaining the blog on Habr for four years now, we can clearly observe the dynamics:
2016. The blog has published 72 posts — 58 (80%) of which had a positive rating and 14 (20%) had a negative rating.
2017. The blog has published 170 posts, of which only one (0.58%) had a negative rating.
2018. A total of 260 posts have been published, all of which had a positive rating.
2019. In Dudya's voice: Three hundred and eight posts.
Of which 308 posts had a positive rating.

In 2018, we thought we had gone crazy — there were 247 working days that year, and we published 260 posts, meaning one post a day and a bit more on weekends. This year has the same number of working days, but the number of posts has increased — we've found our rhythm, gained momentum, and the workload doesn’t seem unmanageable. Moreover, we feel this isn’t the limit of our capabilities — there’s a sense that in 2020 we might go even crazier, so you can read us twice a day 🙂 Just a joke (though there’s some truth in every joke).
We are still focused on translations — we select content across the web for our main target audience — developers and administrators. We select ourselves and translate based on readers' requests. We consider this the optimal option — the quality of the publication and the community's reaction can be anticipated, allowing us to calculate resource costs. But it can no longer be said that the RUVDS blog consists solely of translations — this year we decided to put more effort into original content. A report , a series of articles about en , hardware tests and much more — you have probably read some of this. We will try to increase the share of original content in the new year — if you want to publish something on Habr, please write to us, we'll make arrangements.
In the meantime — a big thank you to all readers for positive feedback on our activity.
Let's return to the numbers
Out of 308 publications, none had a negative rating, although there were downvotes (albeit fewer than in previous years). There were a total of 13232 votes cast (11870 upvotes and 1362 downvotes), the overall rating of the posts was 10508, which means the average post rating was +34 (it was +25 in 2018).
Compared to previous years:
| 2016 | 2017 | 2018 | 2019 | |
|---|---|---|---|---|
| Posts published With positive ratings | 72 58 (80%) 14 (20%) | 170 169 (99.4%) 1 (0.6%) | 260 260 (100%) 0 | 308 308 (100%) 0 |
| Total votes Out of which upvotes Total rating of all posts: | 1681 (~23.3/post) 1235 (73.5%) +789 (~10.9/post) | 5644 (~33/post) 4794 (85%) +3880 (~22.8/post) | 8639 (~33/post) 7580 (87.8%) +6521 (~25/post) | 13232 (~42.9/post) 11870 (89.7%) +10508 (~34/post) |
| Total comments on posts | 1919 (~26.6/post) | 4908 (~28.8/post) | 5255 (~20.2/post) | 7863 (~25.5/post) |
| Total bookmarks added | 5575 (~77.4/post) | 27236 (~160.2/post) | 36182 (~139/post) | 36361 (~118/post) |
| Total views of posts | 1238367 (~17299/post) | 3547173 (~20865/post) | 4247966 (~16338/post) | 4973912 (~16149/post) |
The numbers continue to please us, but as it usually happens, we want more. Therefore, we will try to learn from the mistakes (from comments and reasons for downvotes) and improve in the new year.
Last year we were happy to occasionally be in 1st place in the company ratings, although we never broke the bar of 1000 Habr index units. This year we consistently exceeded this threshold, and our blog held the top spot for almost the entire year.
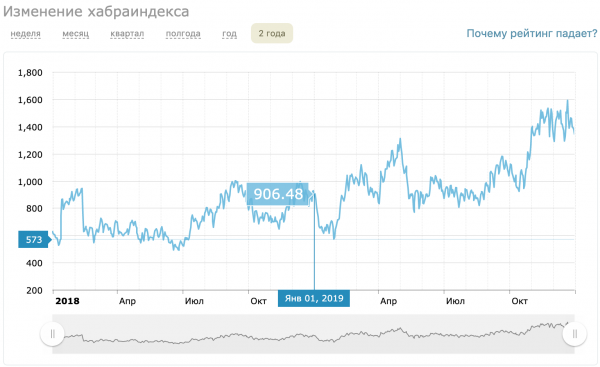
The number of blog subscribers grew from 2000 to 12000 over the year, but evidently, this is primarily due to onboarding new users on Habr.
In which hubs we write the most:
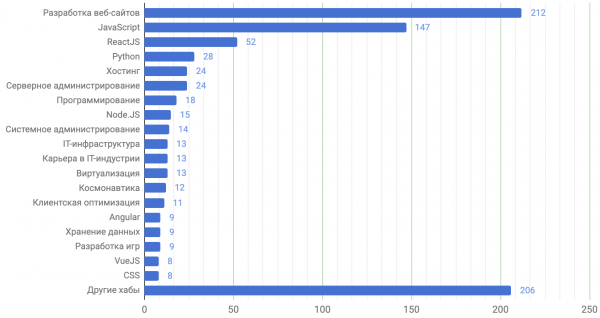
As it was last year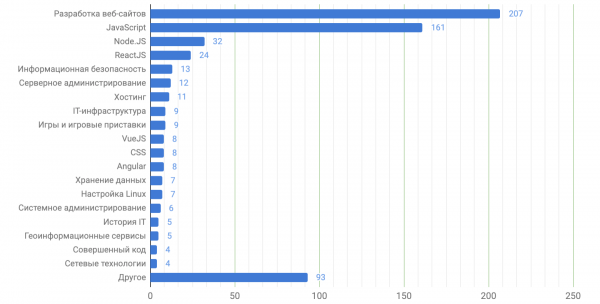
TOP
Top 10 publications of our blog by rating
| 128 | |
| 121 | |
| 103 | |
| 83 | |
| 83 | |
| 79 | |
| 78 | |
| 77 | |
| 75 | |
| 75 |
Het is grappig dat de post met de hoogste beoordeling letterlijk enkele dagen geleden is geschreven.
Top 10 publicaties van onze blog op basis van weergaven
| 110521 | |
| 67458 | |
| 64414 | |
| 59435 | |
| 56406 | |
| 54290 | |
| 51786 | |
| 51114 | |
| 49592 | |
| 46956 |
Top 10 publicaties van onze blog op basis van reacties
| 399 | |
| 285 | |
| 227 | |
| 222 | |
| 182 | |
| 175 | |
| 171 | |
| 166 | |
| 121 | |
| 117 |
Top 10 publicaties van onze blog in favorieten
| 892 | |
| 537 | |
| 519 | |
| 466 | |
| 410 | |
| 395 | |
| 389 | |
| 375 | |
| 358 | |
| 339 |
PDF's!
Grote vertaalcycli verpakken we traditioneel in een PDF-bestand, wat handiger is om op te slaan - ergens in de map met documentatie (of op een e-reader), en niet als een stapel links in favorieten. Dit jaar hadden we slechts één zo'n cyclus - , in 27 publicaties:
→ / 278 страниц, 4.8 Мб
Vorige edities:
→ / 150 страниц, 5 Мб
→ / 120 страниц, 1.8 Мб
→ / 103 страницы, 2 Мб
Het is nog niet helemaal duidelijk hoe we in 2020 nieuwe hoogtes gaan bereiken, maar er is verlangen en sommige plannen. We zouden zeer dankbaar zijn als je in de reacties vertelt wat je (niet) leuk vindt aan onze blog, over welke onderwerpen je zou willen lezen en eigenlijk elke opbouwende feedback.
We wensen je een goede start van het nieuwe jaar en dat je in het nieuwe jaar je gestelde doelen bereikt!
Bron: habr.com
