

Weer . Toekomstige DBA's zullen niet in staat zijn om rechtstreeks verbinding te maken met PROD-servers, maar kunnen gebruikmaken van Jenkins jobs voor een beperkte set van operaties. DBA start een job en krijgt na enige tijd een e-mail met een rapport over de uitvoering van deze operatie. Laten we de manieren bekijken om deze resultaten aan de gebruiker te presenteren.

Gewone tekst
Laten we beginnen met het meest triviale. De eerste methode is zo eenvoudig dat er eigenlijk niet veel over te zeggen is (de auteur gebruikt hier en verder FreeStyle jobs):
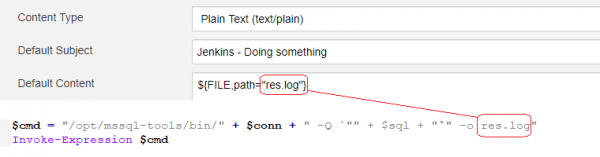
sqlcmd die iets uitvoert, en we presenteren dit aan de gebruiker. Ideaal voor bijvoorbeeld backup jobs:
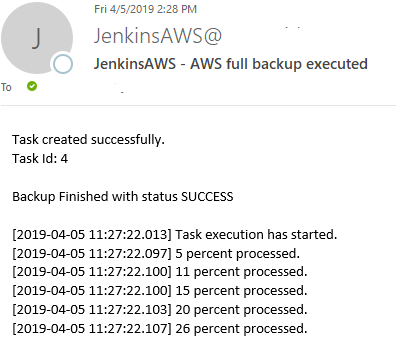
Vergeet trouwens niet dat onder RDS backup/restore asynchroon is, dus het zou goed zijn om daarop te wachten:
declare @rds table
  (id int, task_type varchar(128), database_name sysname, pct int, duration int,
   lifecycle varchar(128), taskinfo varchar(max) null,
   upd datetime, cre datetime,
   s3 varchar(256), ovr int, KMS varchar(256) null)
waitfor delay '00:00:20'
insert into @rds exec msdb.dbo.rds_task_status @db_name='{db}'
select @xid=max(id) from @rds

again:
waitfor delay '00:00:02'
delete from @rds
insert into @rds exec msdb.dbo.rds_task_status @db_name='{db}'
# {db} wordt door powershell vervangen door de db-naam
select @stat=lifecycle,@info=taskinfo from @rds where id=@xid
if @stat not in ('ERROR','SUCCESS','CANCELLED') goto again
De tweede manier, CSV
Hier is alles ook heel eenvoudig:
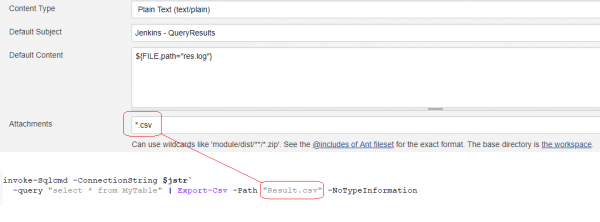
Echter, deze methode werkt alleen als de gegevens die in CSV worden teruggegeven 'eenvoudig' zijn. Als je bijvoorbeeld probeert een lijst van de TOP N CPU-intensieve queries op deze manier terug te geven, dan zal de CSV 'uit elkaar vallen' omdat de tekst van de query verschillende tekens kan bevatten — komma's, aanhalingstekens en zelfs nieuwe regels. Daarom hebben we iets ingewikkelder nodig.
Mooie tabellen in HTML
Hier is een fragment van de code
$Header = @"
<style>
TABLE {border-width: 1px; border-style: solid; border-color: black; border-collapse: collapse;}
TH {border-width: 1px; padding: 3px; border-style: solid; border-color: black; background-color: #6495ED;}
TD {border-width: 1px; padding: 3px; border-style: solid; border-color: black;}
</style>
"@

$Result = invoke-Sqlcmd -ConnectionString $jstr -Query "select * from DbInv" `
  | Select-Object -Property * -ExcludeProperty "ItemArray", "RowError", "RowState", "Table", "HasErrors"
if ($Result -eq $null) { $cnt = 0; }
elseif ($Result.getType().FullName -eq "System.Management.Automation.PSCustomObject") { $cnt = 1; }
else { $cnt = $Result.Rows.Count; }
if ($cnt -gt 0) {
  $body = "<h2>Mijn tabel</h2>"
  $Result | ConvertTo-HTML -Title "Rijen" -Head $header -body $body `
    | Out-File "res.log" -Append -Encoding UTF8
  } else {
    "<h3>Geen gegevens</h3>" | Out-File "res.log" -Append -Encoding UTF8
  }
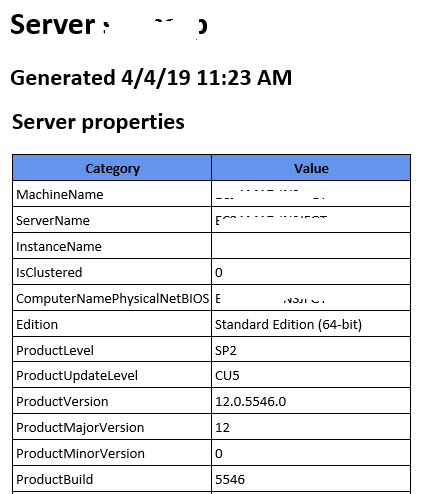
Trouwens, let op de regel met System.Management.Automation.PSCustomObject, deze is magisch; als er precies één regel in de grid staat, kunnen er problemen optreden. De oplossing is uit het internet gehaald zonder veel uitleg. Als resultaat krijg je de output die ongeveer zo wordt weergegeven:
Grafieken tekenen
Let op: de vreemde code hieronder!
Er is een grappige query op de SQL-server die de CPU van de afgelopen N minuten toont — blijkens het blijkt dat de majoor alles opschrijft! Probeer deze query:
DECLARE @ts_now bigint = (SELECT cpu_ticks/(cpu_ticks/ms_ticks)
  FROM sys.dm_os_sys_info WITH (NOLOCK));
SELECT TOP(256)
  DATEADD(ms, -1 * (@ts_now - [timestamp]), GETDATE()) AS [EventTime],
  SQLProcessUtilization AS [SQLCPU],
  100 - SystemIdle - SQLProcessUtilization AS [OtherCPU]
FROM (SELECT record.value('(. /Record/@id)[1]', 'int') AS record_id,
  record.value('(. /Record/SchedulerMonitorEvent/SystemHealth/SystemIdle)[1]', 'int')
    AS [SystemIdle],
  record.value('(. /Record/SchedulerMonitorEvent/SystemHealth/ProcessUtilization)[1]', 'int')
    AS [SQLProcessUtilization], [timestamp]
  FROM (SELECT [timestamp], CONVERT(xml, record) AS [record]
  FROM sys.dm_os_ring_buffers WITH (NOLOCK)
  WHERE ring_buffer_type = N'RING_BUFFER_SCHEDULER_MONITOR'
    AND record LIKE N'%%') AS x) AS y
ORDER BY 1 DESC OPTION (RECOMPILE);
Nu, laten we dit formaat gebruiken (variabele $Fragment)
<table style="width: 100%"><tbody><tr style="background-color: white; height: 2pt;">
  <td style="width: SQLCPU%; background-color: green;"></td>
  <td style="width: OtherCPU%; background-color: blue;"></td>
  <td style="width: REST%; background-color: #C0C0C0;"></td></tr></tbody>
</table>
We kunnen de lichaam van de e-mail opstellen:
$Result = invoke-Sqlcmd -ConnectionString $connstr -Query $Query `
  | Select-Object -Property * -ExcludeProperty `
  "ItemArray", "RowError", "RowState", "Table", "HasErrors"
if ($Result.HasRows) {
  foreach($item in $Result)
    {
    $time = $itemEventTime
    $sqlcpu = $item.SQLCPU
    $other = $itemOtherCPU
    $rest = 100 - $sqlcpu - $other
    $f = $fragment -replace "SQLCPU", $sqlcpu
    $f = $f -replace "OtherCPU", $other
    $f = $f -replace "REST", $rest
    $f | Out-File "res.log" -Append -Encoding UTF8
    }
Het zal er als volgt uitzien:
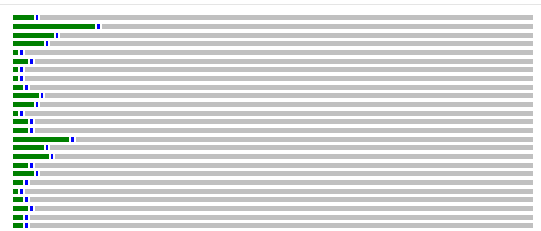
Ja, meneer weet wel raad met perversiteit! Interessant is dat deze code bevat: Powershell (waarop het is geschreven), SQL, Xquery, HTML. Jammer dat we geen Javascript aan HTML kunnen toevoegen (aangezien dit voor een e-mail is), maar het is de plicht van iedereen om de Python-code (die in SQL kan worden gebruikt) te verbeteren!
Uitvoer SQL profiler trace
Het is duidelijk dat de trace "niet in" de CSV zal komen vanwege het TextData-veld. Maar de trace in een grid in een e-mail weergeven is ook vreemd — zowel vanwege de grootte als omdat deze gegevens vaak voor verdere analyse worden gebruikt. Daarom doen we het volgende: we roepen aan via invoke-SqlCmd een script waarin het volgende gebeurt
select
  SPID,EventClass,TextData,
  Duration,Reads,Writes,CPU,
  StartTime,EndTime,DatabaseName,HostName,
  ApplicationName,LoginName
   from ::fn_trace_gettable ( @filename , default )
Vervolgens, op een vriend de server, dat toegankelijk is voor de DBA, is er een Traces-database met een lege template, een tabel Model, die klaar is om alle opgegeven kolommen te ontvangen. We kopiëren dit model naar een nieuwe tabel met een unieke naam:
$dt = Get-Date -format "yyyyMMdd"
$tm = Get-Date -format "hhmmss"
$tableName = $srv + "_" + $dt + "_" + $tm
$copytab = "select * into " + $tableName + " from Model"
invoke-SqlCmd -ConnectionString $tstr -Query $copytab
En nu kunnen we onze trace erin schrijven met behulp van Data.SqlClient.SqlBulkCopy — een voorbeeld hiervan heb ik hierboven al gegeven. Ja, het zou ook goed zijn om constante maskeringen in TextData te maken:
# mask data
foreach ($Row in $Result)
{
  $v = $Row["TextData"]
  $v = $v -replace "'([^']{2,})'", "'str'" -replace "[0-9][0-9]+", '999'
  $Row["TextData"] = $v
}
We replace numbers longer than one digit with 999, and strings longer than one character are replaced with 'str'. Numbers from 0 to 9 are often used as flags, and we leave them untouched, as well as empty and single-character strings — among them we often find 'Y', 'N', etc.
Let’s add some color to our lives (strictly 18+)
In tables, we often want to highlight cells that require attention. For example, FAILS, high fragmentation level, etc. Of course, this can also be done with raw SQL, forming HTML using PRINT, and in Jenkins setting the file type to HTML:
declare @body varchar(max), @chunk varchar(max)
set @body='<font face="Lucida Console" size="3">'
set @body=@body+'<b>Server naam: '+@@servername+'</b><br>'
set @body=@body+'<br><br>'
set @body=@body+'<table><tr><th>Job</th><th>Laatste uitvoering</th><th>Gem. duur, sec</th><th>Laatste uitvoering, sec</th><th>Laatste status</th></tr>'
print @body

DECLARE tab CURSOR FOR SELECT '<tr><td>'+name+'</td><td>'+
  LaatsteUitvoering+'</td><td>'+
  convert(varchar,GemDuur)+'</td><td>'+
  convert(varchar,LaatsteDuur)+'</td><td>'+
    case when LaatsteStatus<>'Geslaagd' then '<font color="red">' else '' end+
      LaatsteStatus+
      case when LaatsteStatus<>'Geslaagd' then '</font>' else '' end+
     +'</td><td>'
  from #j2
OPEN tab;
FETCH NEXT FROM tab into @chunk
WHILE @@FETCH_STATUS = 0
BEGIN
  print @chunk
  FETCH NEXT FROM tab into @chunk;
END
CLOSE tab;
DEALLOCATE tab;
print '</table>'
Why did I write such code?

But there is a more elegant solution. ConvertTo-HTML does not allow us to color the cells, but we can do this afterwards. For example, we want to highlight cells with a fragmentation level over 80 and over 90. Let’s add styles:
.SQLmarkup-red { color: red; background-color: yellow; }
.SQLmarkup-yellow { color: black; background-color: #FFFFE0; }
.SQLmarkup-default { color: black; background-color: white; }
In the query itself, we will add a dummy column directly before the column that we want to color. The column should be named SQLmarkup-something:
case
  when ps.avg_fragmentation_in_percent>=90.0 then 'SQLmarkup-red'
  when ps.avg_fragmentation_in_percent>=80.0 then 'SQLmarkup-yellow'
  else 'SQLmarkup-default'
  end as [SQLmarkup-1],
ps.avg_fragmentation_in_percent,
Now, having received the HTML created by PowerShell, we will remove the dummy column from the header and in the body of the data, we will transfer the value from the column to the style. This is done with just two substitutions:
$html = $html `
  -vervangen "<th>SQLmarkup[^<]*</th>", "" `
  -vervangen "<td>SQLmarkup-(.+?)</td><td>",'<td class="SQLmarkup-$1">'
Resultaat:
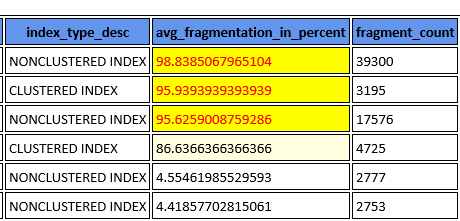
Isn't it elegant? Although no, this coloring reminds me of something

Bron: habr.com
