

Olá a todos. Em maio, a OTUS lançará , tanto de infraestrutura quanto de aplicações, utilizando Zabbix, Prometheus, Grafana e ELK. Em decorrência disso, tradicionalmente compartilhamos materiais úteis sobre o tema.
para o Prometheus permite implementar a monitoração de serviços externos via HTTP, HTTPS, DNS, TCP e ICMP. Neste artigo, mostrarei como configurar o monitoramento de HTTP/HTTPS usando o exportador Blackbox. Vamos executar o exportador Blackbox no Kubernetes.
Ambiente
Precisaremos do seguinte:
- Kubernetes
- Prometheus Operator
Configuração do exportador Blackbox
Configuramos o Blackbox através do ConfigMap para a configuração http do módulo de monitoramento de serviços web.
apiVersion: v1
kind: ConfigMap
metadata:
  name: prometheus-blackbox-exporter
  labels:
    app: prometheus-blackbox-exporter
data:
  blackbox.yaml: |
    modules:
      http_2xx:
        http:
          no_follow_redirects: false
          preferred_ip_protocol: ip4
          valid_http_versions:
          - HTTP/1.1
          - HTTP/2
          valid_status_codes: []
        prober: http
        timeout: 5s
Módulo http_2xx é utilizado para verificar se o serviço web retorna um código de estado HTTP 2xx. Veja mais sobre a configuração do exportador Blackbox em .
Implantação do exportador Blackbox no cluster Kubernetes
Descreva Deployment e Service para a implantação no Kubernetes.
---
kind: Service
apiVersion: v1
metadata:
  name: prometheus-blackbox-exporter
  labels:
    app: prometheus-blackbox-exporter
spec:
  type: ClusterIP
  ports:
    - name: http
      port: 9115
      protocol: TCP
  selector:
    app: prometheus-blackbox-exporter

---
apiVersion: apps/v1
kind: Deployment
metadata:
  name: prometheus-blackbox-exporter
  labels:
    app: prometheus-blackbox-exporter
spec:
  replicas: 1
  selector:
    matchLabels:
      app: prometheus-blackbox-exporter
  template:
    metadata:
      labels:
        app: prometheus-blackbox-exporter
    spec:
      restartPolicy: Always
      containers:
        - name: blackbox-exporter
          image: "prom/blackbox-exporter:v0.15.1"
          imagePullPolicy: IfNotPresent
          securityContext:
            readOnlyRootFilesystem: true
            runAsNonRoot: true
            runAsUser: 1000
          args:
            - "--config.file=/config/blackbox.yaml"
          resources:
            {}
          ports:
            - containerPort: 9115
              name: http
          livenessProbe:
            httpGet:
              path: /health
              port: http
          readinessProbe:
            httpGet:
              path: /health
              port: http
          volumeMounts:
            - mountPath: /config
              name: config
        - name: configmap-reload
          image: "jimmidyson/configmap-reload:v0.2.2"
          imagePullPolicy: "IfNotPresent"
          securityContext:
            runAsNonRoot: true
            runAsUser: 65534
          args:
            - --volume-dir=/etc/config
            - --webhook-url=http://localhost:9115/-/reload
          resources:
            {}
          volumeMounts:
            - mountPath: /etc/config
              name: config
              readOnly: true
      volumes:
        - name: config
          configMap:
            name: prometheus-blackbox-exporter
O exportador Blackbox pode ser implantado usando o seguinte comando. O namespace monitoramento relaciona-se ao Prometheus Operator.
kubectl --namespace=monitoring apply -f blackbox-exporter.yamlCertifique-se de que todos os serviços estão em execução, utilizando o seguinte comando:
kubectl --namespace=monitoring get all --selector=app=prometheus-blackbox-exporterVerificação do Blackbox
Você pode acessar a interface web do Blackbox exporter através de port-forward:
kubectl --namespace=monitoring port-forward svc/prometheus-blackbox-exporter 9115:9115Conecte-se à interface web do Blackbox exporter através do navegador no endereço :9115.
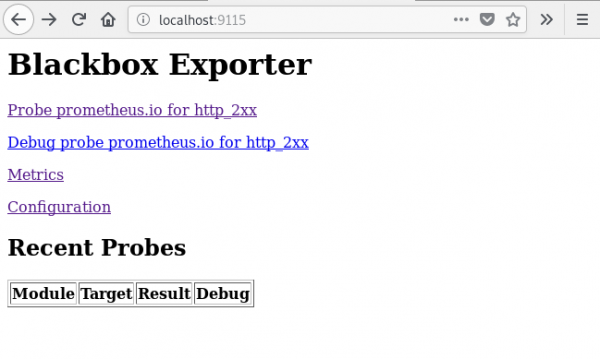
Se você acessar o endereço , você verá o resultado da verificação do URL especificado ().
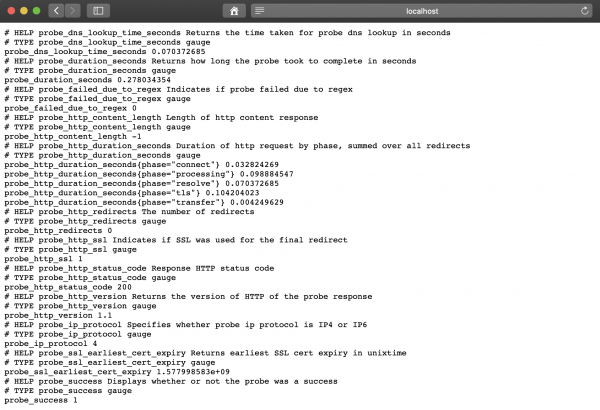
Valor da métrica probe_success igual a 1 significa verificação bem-sucedida. O valor 0 indica erro.
Configuração do Prometheus
Após a implantação do BlackBox exporter, configure o Prometheus em prometheus-additional.yaml.
- job_name: 'kube-api-blackbox'
  scrape_interval: 1w
  metrics_path: /probe
  params:
    module: [http_2xx]
  static_configs:
   - targets:
      - https://www.google.com
      - http://www.example.com
      - https://prometheus.io
  relabel_configs:
   - source_labels: [__address__]
     target_label: __param_target
   - source_labels: [__param_target]
     target_label: instance
   - target_label: __address__
     replacement: prometheus-blackbox-exporter:9115 # O blackbox exporter.
Gerando Segredo, utilizando o seguinte comando.
PROMETHEUS_ADD_CONFIG=$(cat prometheus-additional.yaml | base64)
cat << EOF | kubectl --namespace=monitoring apply -f -
apiversion: v1
kind: Secret
metadata:
  name: additional-scrape-configs
type: Opaque
data:
  prometheus-additional.yaml: $PROMETHEUS_ADD_CONFIG
EOF
Especifique additional-scrape-configs para o Prometheus Operator, utilizando additionalScrapeConfigs.
kubectl --namespace=monitoring edit prometheuses k8s
...
spec:
  additionalScrapeConfigs:
    key: prometheus-additional.yaml
    name: additional-scrape-configs
Acesse a interface web do Prometheus, verifique as métricas e os alvos.
kubectl --namespace=monitoring port-forward svc/prometheus-k8s 9090:9090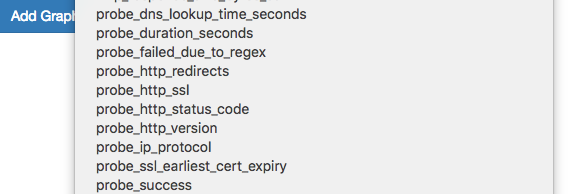
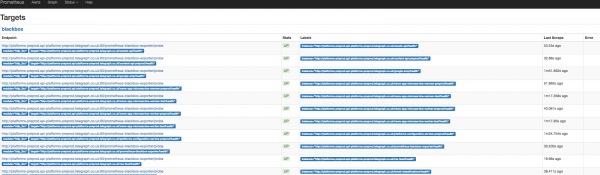
Vemos as métricas e os alvos do Blackbox.
Adicionando regras para notificações (alert)
Para receber notificações do Blackbox exporter, adicionaremos regras ao Prometheus Operator.
kubectl --namespace=monitoring edit prometheusrules prometheus-k8s-rules
...
  - name: blackbox-exporter
    rules:
    - alert: ProbeFailed
      expr: probe_success == 0
      for: 5m
      labels:
        severity: error
      annotations:
        summary: "Probe falhou (instância {{ $labels.instance }})"
        description: "Probe falhoun  VALOR = {{ $value }}n  RÓTULOS: {{ $labels }}"
    - alert: SlowProbe
      expr: avg_over_time(probe_duration_seconds[1m]) > 1
      for: 5m
      labels:
        severity: warning
      annotations:
        summary: "Probe lenta (instância {{ $labels.instance }})"
        description: "Probe Blackbox levou mais de 1s para completarn  VALOR = {{ $value }}n  RÓTULOS: {{ $labels }}"
    - alert: HttpStatusCode
      expr: probe_http_status_code = 400
      for: 5m
      labels:
        severity: error
      annotations:
        summary: "Código de Status HTTP (instância {{ $labels.instance }})"
        description: "O código de status HTTP não está entre 200-399n  VALOR = {{ $value }}n  RÓTULOS: {{ $labels }}"
    - alert: SslCertificateWillExpireSoon
      expr: probe_ssl_earliest_cert_expiry - time() < 86400 * 30
      for: 5m
      labels:
        severity: warning
      annotations:
        summary: "O certificado SSL expirará em breve (instância {{ $labels.instance }})"
        description: "O certificado SSL expira em 30 diasn  VALOR = {{ $value }}n  RÓTULOS: {{ $labels }}"
    - alert: SslCertificateHasExpired
      expr: probe_ssl_earliest_cert_expiry - time()  1
      for: 5m
      labels:
        severity: warning
      annotations:
        summary: "Requisições HTTP lentas (instância {{ $labels.instance }})"
        description: "A requisição HTTP levou mais de 1sn  VALOR = {{ $value }}n  RÓTULOS: {{ $labels }}"
    - alert: SlowPing
      expr: avg_over_time(probe_icmp_duration_seconds[1m]) > 1
      for: 5m
      labels:
        severity: warning
      annotations:
        summary: "Ping lento (instância {{ $labels.instance }})"
        description: "O ping Blackbox levou mais de 1sn  VALOR = {{ $value }}n  RÓTULOS: {{ $labels }}"
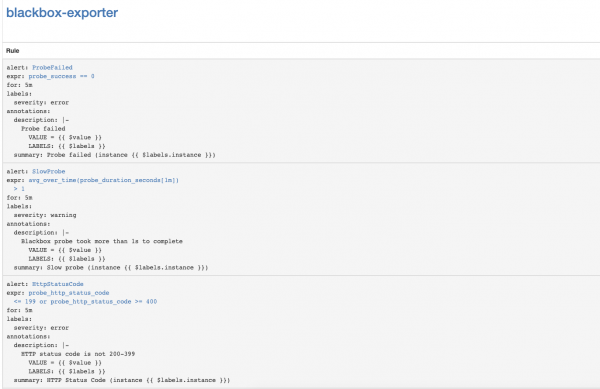
No interface web do Prometheus, vá para Status => Rules e localize as regras de alerta para blackbox-exporter.
Configuração de notificações sobre a expiração do certificado SSL do Kubernetes API Server
Vamos configurar o monitoramento da expiração do certificado SSL do Kubernetes API Server. Ele enviará notificações uma vez por semana.
Adicionando o módulo Blackbox exporter para autenticação do Kubernetes API Server.
kubectl --namespace=monitoring edit configmap prometheus-blackbox-exporter
...
      kube-api:
        http:
          method: GET
          no_follow_redirects: false
          preferred_ip_protocol: ip4
          tls_config:
            insecure_skip_verify: false
            ca_file: /var/run/secrets/kubernetes.io/serviceaccount/ca.crt
          bearer_token_file: /var/run/secrets/kubernetes.io/serviceaccount/token
          valid_http_versions:
          - HTTP/1.1
          - HTTP/2
          valid_status_codes: []
        prober: http
        timeout: 5s
Adicionando a configuração de coleta do Prometheus
- job_name: 'kube-api-blackbox'
  metrics_path: /probe
  params:
    module: [kube-api]
  static_configs:
   - targets:
      - https://kubernetes.default.svc/api
  relabel_configs:
   - source_labels: [__address__]
     target_label: __param_target
   - source_labels: [__param_target]
     target_label: instance
   - target_label: __address__
     replacement: prometheus-blackbox-exporter:9115 # O exportador blackbox.
Aplicando o Secret do Prometheus
PROMETHEUS_ADD_CONFIG=$(cat prometheus-additional.yaml | base64)
cat << EOF | kubectl --namespace=monitoring apply -f -
apiversion: v1
kind: Secret
metadata:
  name: additional-scrape-configs
type: Opaque
data:
  prometheus-additional.yaml: $PROMETHEUS_ADD_CONFIG
EOF
Adicionando regras de alerta
kubectl --namespace=monitoring edit prometheusrules prometheus-k8s-rules
...
  - name: k8s-api-server-cert-expiry
    rules:
    - alert: K8sAPIServerSSLCertExpiringAfterThreeMonths
      expr: probe_ssl_earliest_cert_expiry{job="kube-api-blackbox"} - time() < 86400 * 90
      for: 1w
      labels:
        severity: warning
      annotations:
        summary: "O certificado SSL do servidor API Kubernetes expirará em três meses (instância {{ $labels.instance }})"
        description: "O certificado SSL do servidor API Kubernetes expira em 90 diasn  VALOR = {{ $value }}n  RÓTULOS: {{ $labels }}"
Links Úteis
Fonte: habr.com
