

Dobrodošli na 12. lekciju. Danas ćemo razgovarati o još jednoj veoma važnoj temi, naime, o radu s logovima i izveštajima. Ponekad se ova funkcionalnost pokazuje kao ključna prilikom izbora sredstva zaštite. Bezbednjaci često preferiraju udoban sistem izveštavanja i funkcionalno pretraživanje raznih događaja. Teško ih je kriviti. U suštini, logovi i izveštaji su najvažniji elementi procene sigurnosti. Kako razumeti trenutni nivo bezbednosti ako ne vidite šta se dešava? Na sreću, u tom smislu Check Point ima sve u najboljem redu, pa čak i više. Check Point ima jedan od najboljih sistema izveštavanja koji radi bez dodatne konfiguracije! Uz to, postoji mogućnost prilagođavanja i kreiranja vlastitih izveštaja! Sve to je dopunjeno jednostavnim i intuitivnim procesom rada s logovima. Ali hajde da krenemo redom.
Potpuno novi interfejs
Ako ste ranije radili s Check Point-om, verovatno ste bili iznenađeni potpuno novim interfejsom za rad s logovima i izveštajima u R80. Na slici je prikazano koliko je različitih alata objedinjeno u okviru nove kartice Logs & Monitor:
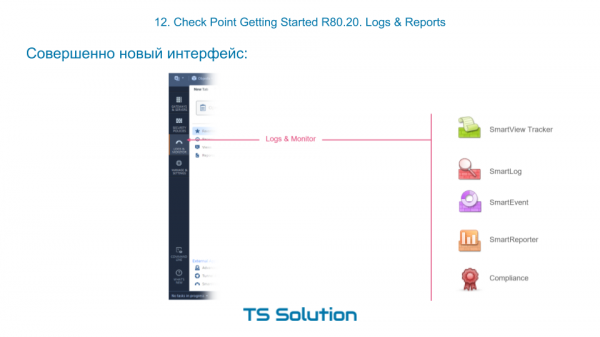
Odsek Logs & Monitor
Ako pređete na Logs & Monitor i otvorite novu karticu, trebalo bi da vidite otprilike sledeće:
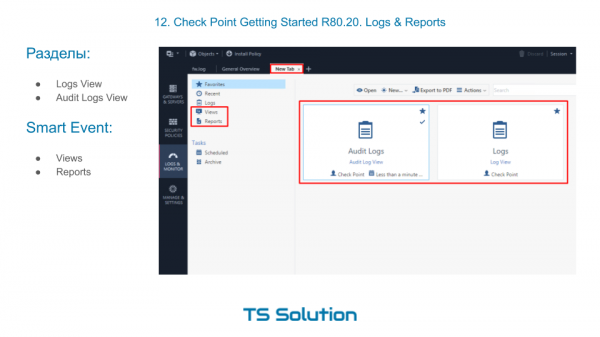
Po difoltu ovde postoje dva velika odeljka:
- Audit Logs View — ovde možete pronaći sve događaje vezane za ulaz/izlaz administratora, promene u konfiguraciji itd. To jest, klasičan audit radnji administratora.
- Logs View — ovde se može pretraživati događaje koje 'generišu' svi naši aktivirani moduli, bilo da je reč o firewall-u, antivirusu, IPS-u itd. Više puta smo koristili ovu funkcionalnost.
Pored toga, ovde su i linkovi ka izveštajima (Reports) i raznim kontrolnim tablama (Views). Za njihovo funkcionisanje potreban je aktivni modul Smart Event. O tome ćemo kasnije. Prvo da vidimo kako raditi s logovima.
Log Search
Po mom mišljenju, rad s logovima u R80 je pravo uživanje. Imamo vrlo pametnu pretraživačku traku, koja nam omogućava da 'pretražujemo' i po proizvoljnom tekstu, i po modu, i po bilo kojim drugim indeksiranim parametrima kao što su izvor, odredište, akcija itd.
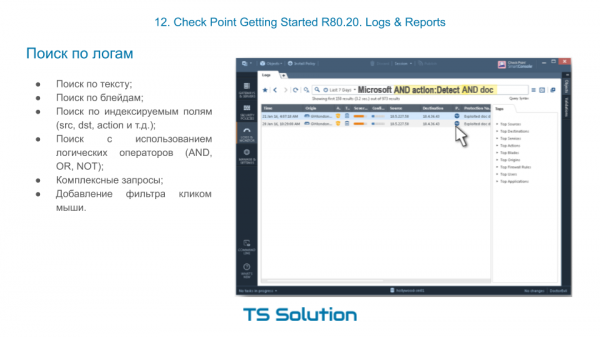
Pri tome možemo sastavljati vrlo složene upite koristeći logičke operatore AND, ILI, NOT. In order to do this, you don't even need to type anything. You can create a filter literally in a couple of clicks.
Displaying Log Messages by Access-List
We have already evaluated the capability to display logs by a specific access list. It's incredibly convenient and you quickly get used to it. This is especially helpful during troubleshooting. You select an interesting 'access-list' and then check below whether the needed traffic falls under it.
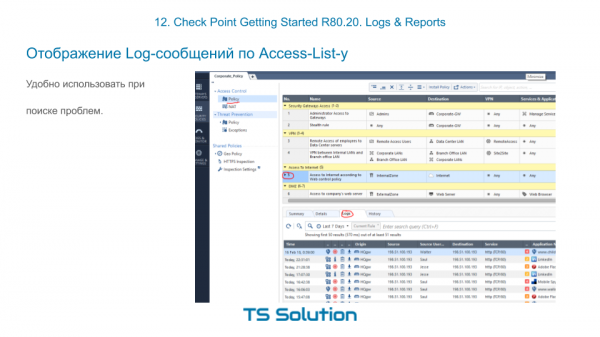
You don't need to go anywhere or create a complicated log filter.
Views & Reports
The blade responsible for reporting and data visualization in Check Point is Smart Event, which is activated on strežnikom management. This functionality could confidently be called a SIEM, but only for Check Point products! Technically, you can funnel logs from other systems (like Cisco, Microsoft, etc.) into Smart Event, but that's not usually the best idea 🙂 In practice, it's quite problematic. However, SmartEvent handles 'Checkpoint' logs exceptionally well. It can correlate, sum up, average, and much more. And all of this works out of the box! Naturally, there are already ready-made dashboards for displaying the most important information. In Check Point, they are called Views:
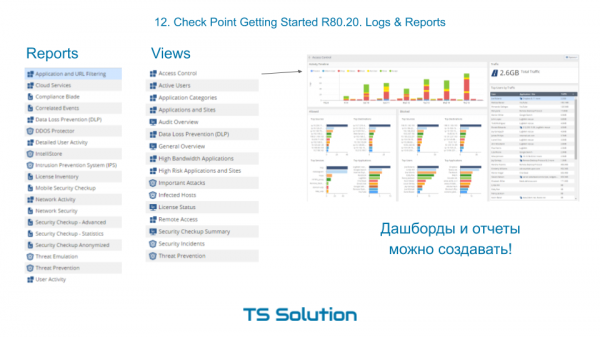
You can see that there are quite a few default dashboards here that are very useful in everyday administration and monitoring.
Besides dashboards where information is simply visualized, there is an option to generate full reports and save them in PDF or Excel format. You can generate them on a schedule and send them to a specific email address.
And the best part! You can create your own dashboards and reports! That is, you're not limited to the built-in ones. Not every vendor can boast this. Moreover, the templates for these dashboards or reports can be imported or exported, allowing users to share their works. The process of creating a dashboard is quite simple and intuitive. I will try to show you this within the scope of the lab work, which you will find in the video lesson below.
Video lekcija

Ostanite z nami in se pridružite našemu 🙂
Izvor: habr.com
