

A few lines of code and your application generates metrics, wow!
To understand how prometheus_ works,flask_exporter a minimal example is enough:
from flask import Flask
from prometheus_flask_exporter import PrometheusMetrics

app = Flask(__name__)
metrics = PrometheusMetrics(app)

@app.route('/')
def main():
    return 'OK'
That's all you need to get started! By adding the import and the line for initialization PrometheusMetrics, you will receive metrics request duration in request counters, displayed at the endpoint /metrics of the Flask application where it's registered, along with all the default metrics you get from the basic .
You can find in the GitHub repository, which runs an instance in along with a demo application to generate metrics that will look something like this:
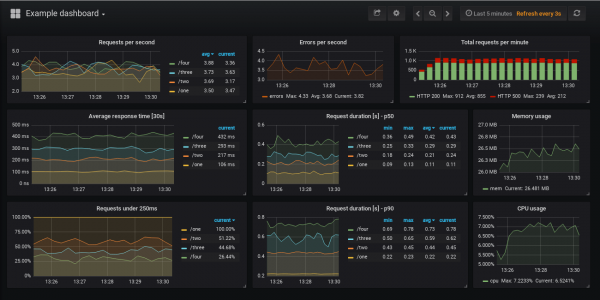
You will also find a list of metrics in of the example, which are displayed on the dashboard, along with the Prometheus queries that populate the panels.
Setup
The library has many configuration options, check out the project for their examples with a brief explanation.
The basic configuration is shown at the top. Just create an instance PrometheusMetrics, let's call it metrics, and then use it to define additional metrics you want to collect by decorating functions:
@metrics.counter(..)@metrics.gauge(..)@metrics.summary(..)@metrics.histogram(..)
Counters count the invocations, while the others collect metrics based on the duration of these calls. You can define labels for each of them, potentially using request or response properties. For example:
from flask import Flask, request
from prometheus_flask_exporter import PrometheusMetrics

app = Flask(__name__)

# group by endpoint rather than path
metrics = PrometheusMetrics(app, group_by='endpoint')

@app.route('/collection/:collection_id/item/:item_id')
@metrics.counter(
    'cnt_collection', 'Number of invocations per collection', labels={
        'collection': lambda: request.view_args['collection_id'],
        'status': lambda resp: resp.status_code
    })
def get_item_from_collection(collection_id, item_id):
    pass
In the example above, hitting the endpoint /collection/10002/item/76 will increase the counter, for example cnt_collection{collection = "10002", status = "200"}, plus you’ll get the default metrics (for each endpoint in this example) from the default library:
flask_http_request_duration_seconds— HTTP request duration in seconds for all Flask requests by method, path, and statusflask_http_request_total— Skupno število HTTP zahtevkov po metodah in statusih
Obstajajo možnosti, da preskočite sledenje določenim končnim točkam, zabeležite dodatne meritev privzeto ali preskočite tiste, ki so navedene zgoraj, ali pa uporabite isto prilagodljivo meritev za več končnih točk. Oglejte si projekt, da vidite, kaj je na voljo.
app = Flask(__name__)
metrics = PrometheusMetrics(app)

@app.route('\/')
def main():
    pass  # zahtevki se sledijo privzeto

@app.route('\/skip')
@metrics.do_not_track()
def skip():
    pass  # privzete meritve se ne zbirajo

# prilagodljiva mera, ki se uporablja za več končnih točk
common_counter = metrics.counter(
    'by_endpoint_counter', 'Število zahtevkov po končnih točkah',
    labels={'endpoint': lambda: request.endpoint}
)

@app.route('\/common\/one')
@common_counter
def endpoint_one():
    pass  # sledili bomo s prilagojeno in privzeto meritev

@app.route('\/common\/two')
@common_counter
def endpoint_two():
    pass  # tudi sledimo s prilagojeno in privzeto meritev

# registrirajte dodatne privzete meritve
metrics.register_default(
    metrics.counter(
        'by_path_counter', 'Število zahtevkov po poteh zahtevkov',
        labels={'path': lambda: request.path}
    )
)
V knjižnici so priročne razširitve za priljubljene večprocesorske knjižnice, kot sta uWSGI in Gunicorn. Prav tako lahko najdete majhne primere ciljanih možnosti uporabe, vključno z večprocesorjem.
Zbiranje metrik
Kot je omenjeno zgoraj, knjižnica privzeto zagotavlja končno točko /metrics v aplikaciji Flask, ki lahko služi kot cilj za .
V zgornjem primeru z nadzorno ploščo lahko usmerite svoj Prometheus na aplikacijo Flask s privzetimi nastavitvami s to konfiguracijo:
scrape_configs:
  - job_name: 'example'

    dns_sd_configs:
      - names: ['app']
        port: 5000
        type: A
        refresh_interval: 5s
Oglejte si celoten primer v . To predpostavlja, da lahko Prometheus najde vaše primerke aplikacije Flask na http://app:5000/metrics, kjer se ime domene aplikacije lahko potencialno razreši na več IP naslovov, na primer pri delovanju v ili .
Če to razkrivanje končne točke metrik za vas ni ustrezno, morda zato, ker ne želite, da bi imel zunanji dostop do nje, jo lahko enostavno onemogočite, tako da posredujete path=None pri ustvarjanju primerka PrometheusMetrics.
from flask import Flask, request
from prometheus_flask_exporter import PrometheusMetrics

app = Flask(__name__)
metrics = PrometheusMetrics(app, path=None)

...

metrics.start_http_server(5099)
Nato lahko uporabite start_http_server(port), da odprete to končno točko na drugem HTTP portu, 5099 v zgoraj navedenem primeru. Kot alternativo, če vam ustreza, da je končna točka v isti aplikaciji Flask, vendar morate spremeniti njeno pot od /metrics, lahko bodisi posredujete drugo URI kot parametra poti, bodisi uporabite register_endpoint(..), da to nastavite pozneje.
Povezave
— Ta izvoznik steklenic za Prometheus
— Uporaba, primeri in konfiguracijske možnosti
— Primeri nastavitve monitoringa aplikacij Flask na različne načine
— Ta projekt je na PyPI
— Uradna odjemalska knjižnica Prometheus za Python
Če se odločite poskusiti, ne oklevajte in odprite težave na GitHubu ali pustite svoje komentarje, mnenja in predloge!
Hvala!
Izvor: habr.com
