

Всем привет. В мае OTUS запускает , как инфраструктуры так и приложений с помощью Zabbix, Prometheus, Grafana и ELK. В связи с этим традиционно делимся полезным материалом по теме.
для Prometheus позволяет реализовать мониторинг внешних сервисов через HTTP, HTTPS, DNS, TCP, ICMP. В этой статье я покажу вам, как настроить мониторинг HTTP/HTTPS с помощью Blackbox экспортера. Запускать Blackbox экспортер будем в Kubernetes.
Окружение
Нам потребуется следующее:
- Kubernetes
- Prometheus Operator
Конфигурация blackbox экспортера
Конфигурируем Blackbox через ConfigMap для настройки http модуля мониторинга веб-служб.
apiVersion: v1
kind: ConfigMap
metadata:
  name: prometheus-blackbox-exporter
  labels:
    app: prometheus-blackbox-exporter
data:
  blackbox.yaml: |
    modules:
      http_2xx:
        http:
          no_follow_redirects: false
          preferred_ip_protocol: ip4
          valid_http_versions:
          - HTTP/1.1
          - HTTP/2
          valid_status_codes: []
        prober: http
        timeout: 5s
Moduli http_2xx используется для проверки того, что веб-сервис возвращает код состояния HTTP 2xx. Подробнее конфигурация blackbox экспортера описана в .
Деплой blackbox экспортера в Kubernetes кластер
Опишите Zhvillimi dhe Shërbimi для развёртывания в Kubernetes.
---
kind: Service
apiVersion: v1
metadata:
  name: prometheus-blackbox-exporter
  labels:
    app: prometheus-blackbox-exporter
spec:
  type: ClusterIP
  ports:
    - name: http
      port: 9115
      protocol: TCP
  selector:
    app: prometheus-blackbox-exporter

---
apiVersion: apps/v1
kind: Deployment
metadata:
  name: prometheus-blackbox-exporter
  labels:
    app: prometheus-blackbox-exporter
spec:
  replicas: 1
  selector:
    matchLabels:
      app: prometheus-blackbox-exporter
  template:
    metadata:
      labels:
        app: prometheus-blackbox-exporter
    spec:
      restartPolicy: Always
      containers:
        - name: blackbox-exporter
          image: "prom/blackbox-exporter:v0.15.1"
          imagePullPolicy: IfNotPresent
          securityContext:
            readOnlyRootFilesystem: true
            runAsNonRoot: true
            runAsUser: 1000
          args:
            - "--config.file=/config/blackbox.yaml"
          resources:
            {}
          ports:
            - containerPort: 9115
              name: http
          livenessProbe:
            httpGet:
              path: /health
              port: http
          readinessProbe:
            httpGet:
              path: /health
              port: http
          volumeMounts:
            - mountPath: /config
              name: config
        - name: configmap-reload
          image: "jimmidyson/configmap-reload:v0.2.2"
          imagePullPolicy: "IfNotPresent"
          securityContext:
            runAsNonRoot: true
            runAsUser: 65534
          args:
            - --volume-dir=/etc/config
            - --webhook-url=http://localhost:9115/-/reload
          resources:
            {}
          volumeMounts:
            - mountPath: /etc/config
              name: config
              readOnly: true
      volumes:
        - name: config
          configMap:
            name: prometheus-blackbox-exporter
Blackbox экспортер можно развернуть с помощью следующей команды. Пространство имен monitoring относится к Prometheus Operator.
kubectl --namespace=monitoring apply -f blackbox-exporter.yamlУбедитесь, что все службы запущены, используя следующую команду:
kubectl --namespace=monitoring get all --selector=app=prometheus-blackbox-exporterПроверка Blackbox
Вы можете получить доступ к веб-интерфейсу Blackbox экспортера с помощью port-forward:
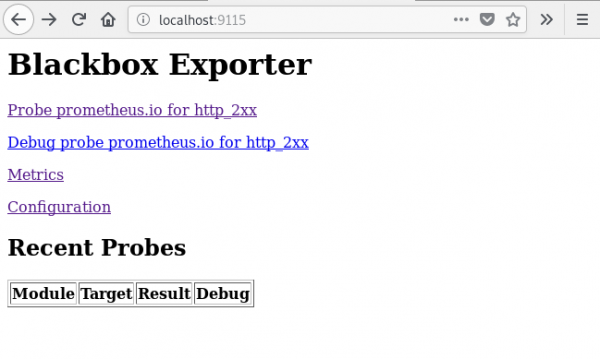
kubectl --namespace=monitoring port-forward svc/prometheus-blackbox-exporter 9115:9115Подключитесь к веб-интерфейсу Blackbox экспортера через веб-браузер по адресу :9115.
Если вы перейдете по адресу , то увидите результат проверки указанного URL ().
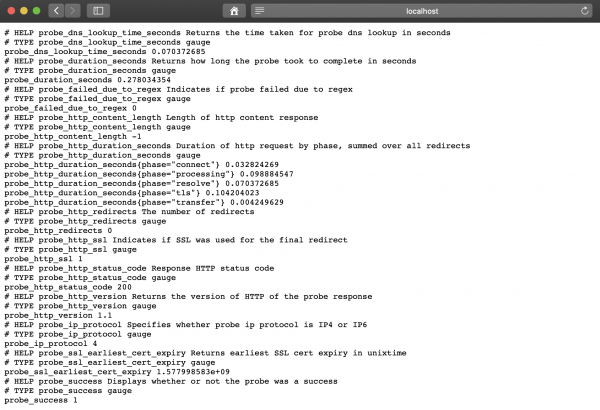
Значение метрики probe_success равное 1 означает успешную проверку. Значение 0 говорит об ошибке.
Настройка Prometheus
После развертывания BlackBox экспортера, настраиваем Prometheus в prometheus-additional.yaml.
- job_name: 'kube-api-blackbox'
  scrape_interval: 1w
  metrics_path: /probe
  params:
    module: [http_2xx]
  static_configs:
   - targets:
      - https://www.google.com
      - http://www.example.com
      - https://prometheus.io
  relabel_configs:
   - source_labels: [__address__]
     target_label: __param_target
   - source_labels: [__param_target]
     target_label: instance
   - target_label: __address__
     replacement: prometheus-blackbox-exporter:9115 # The blackbox exporter.
Генерируем Secret, используя следующую команду.
PROMETHEUS_ADD_CONFIG=$(cat prometheus-additional.yaml | base64)
cat << EOF | kubectl --namespace=monitoring apply -f -
apiVersion: v1
kind: Secret
metadata:
  name: additional-scrape-configs
type: Opaque
data:
  prometheus-additional.yaml: $PROMETHEUS_ADD_CONFIG
EOF
Specifikoni additional-scrape-configs для Prometheus Operator, используя additionalScrapeConfigs.
kubectl --namespace=monitoring edit prometheuses k8s
...
spec:
  additionalScrapeConfigs:
    key: prometheus-additional.yaml
    name: additional-scrape-configs
Заходим в веб-интерфейс Prometheus, проверяем метрики и цели.
kubectl --namespace=monitoring port-forward svc/prometheus-k8s 9090:9090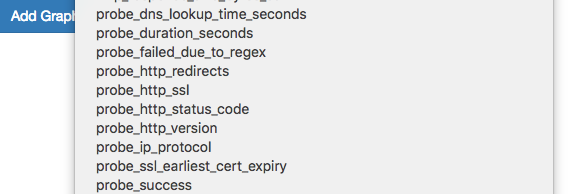
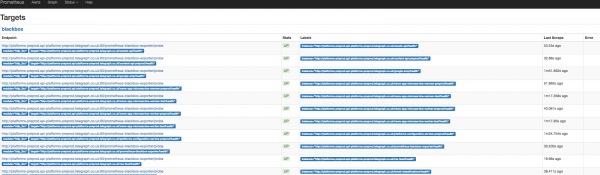
Видим метрики и цели Blackbox.
Добавление правил для уведомлений (alert)
Для получения оповещений от Blackbox экспортера добавим правила в Prometheus Operator.
kubectl --namespace=monitoring edit prometheusrules prometheus-k8s-rules
...
  - name: blackbox-exporter
    rules:
    - alert: ProbeFailed
      expr: probe_success == 0
      for: 5m
      labels:
        severity: error
      annotations:
        summary: "Probe failed (instance {{ $labels.instance }})"
        description: "Probe failedn  VALUE = {{ $value }}n  LABELS: {{ $labels }}"
    - alert: SlowProbe
      expr: avg_over_time(probe_duration_seconds[1m]) > 1
      for: 5m
      labels:
        severity: warning
      annotations:
        summary: "Slow probe (instance {{ $labels.instance }})"
        description: "Blackbox probe took more than 1s to completen  VALUE = {{ $value }}n  LABELS: {{ $labels }}"
    - alert: HttpStatusCode
      expr: probe_http_status_code <= 199 OR probe_http_status_code >= 400
      for: 5m
      labels:
        severity: error
      annotations:
        summary: "HTTP Status Code (instance {{ $labels.instance }})"
        description: "HTTP status code is not 200-399n  VALUE = {{ $value }}n  LABELS: {{ $labels }}"
    - alert: SslCertificateWillExpireSoon
      expr: probe_ssl_earliest_cert_expiry - time() < 86400 * 30
      for: 5m
      labels:
        severity: warning
      annotations:
        summary: "SSL certificate will expire soon (instance {{ $labels.instance }})"
        description: "SSL certificate expires in 30 daysn  VALUE = {{ $value }}n  LABELS: {{ $labels }}"
    - alert: SslCertificateHasExpired
      expr: probe_ssl_earliest_cert_expiry - time()  <= 0
      for: 5m
      labels:
        severity: error
      annotations:
        summary: "SSL certificate has expired (instance {{ $labels.instance }})"
        description: "SSL certificate has expired alreadyn  VALUE = {{ $value }}n  LABELS: {{ $labels }}"
    - alert: HttpSlowRequests
      expr: avg_over_time(probe_http_duration_seconds[1m]) > 1
      for: 5m
      labels:
        severity: warning
      annotations:
        summary: "HTTP slow requests (instance {{ $labels.instance }})"
        description: "HTTP request took more than 1sn  VALUE = {{ $value }}n  LABELS: {{ $labels }}"
    - alert: SlowPing
      expr: avg_over_time(probe_icmp_duration_seconds[1m]) > 1
      for: 5m
      labels:
        severity: warning
      annotations:
        summary: "Slow ping (instance {{ $labels.instance }})"
        description: "Blackbox ping took more than 1sn  VALUE = {{ $value }}n  LABELS: {{ $labels }}"
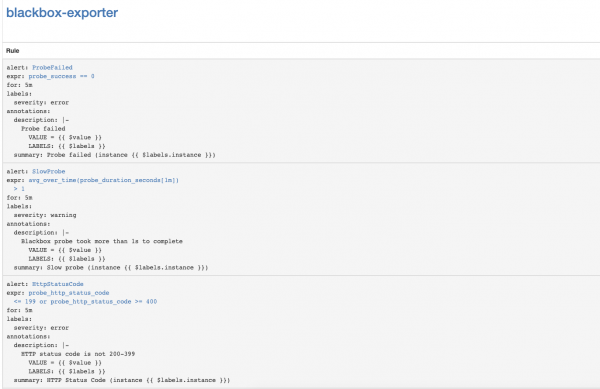
В веб-интерфейсе Prometheus перейдите в раздел Status => Rules и найдите правила оповещений для blackbox-exporter.
Настройка уведомлений об истечении срока действия SSL-сертификатов Kubernetes API Server
Давайте настроим мониторинг истечения срока действия SSL-сертификатов Kubernetes API Server. Он будет отправлять уведомления один раз в неделю.
Добавляем модуль Blackbox экспортера для Kubernetes API Server Authentication.
kubectl --namespace=monitoring edit configmap prometheus-blackbox-exporter
...
      kube-api:
        http:
          method: GET
          no_follow_redirects: false
          preferred_ip_protocol: ip4
          tls_config:
            insecure_skip_verify: false
            ca_file: /var/run/secrets/kubernetes.io/serviceaccount/ca.crt
          bearer_token_file: /var/run/secrets/kubernetes.io/serviceaccount/token
          valid_http_versions:
          - HTTP/1.1
          - HTTP/2
          valid_status_codes: []
        prober: http
        timeout: 5s
Добавляем scrape-конфигурацию Prometheus
- job_name: 'kube-api-blackbox'
  metrics_path: /probe
  params:
    module: [kube-api]
  static_configs:
   - targets:
      - https://kubernetes.default.svc/api
  relabel_configs:
   - source_labels: [__address__]
     target_label: __param_target
   - source_labels: [__param_target]
     target_label: instance
   - target_label: __address__
     replacement: prometheus-blackbox-exporter:9115 # The blackbox exporter.
Применяем Prometheus Secret
PROMETHEUS_ADD_CONFIG=$(cat prometheus-additional.yaml | base64)
cat << EOF | kubectl --namespace=monitoring apply -f -
apiVersion: v1
kind: Secret
metadata:
  name: additional-scrape-configs
type: Opaque
data:
  prometheus-additional.yaml: $PROMETHEUS_ADD_CONFIG
EOF
Добавляем правила оповещений
kubectl --namespace=monitoring edit prometheusrules prometheus-k8s-rules
...
  - name: k8s-api-server-cert-expiry
    rules:
    - alert: K8sAPIServerSSLCertExpiringAfterThreeMonths
      expr: probe_ssl_earliest_cert_expiry{job="kube-api-blackbox"} - time() < 86400 * 90
      for: 1w
      labels:
        severity: warning
      annotations:
        summary: "Kubernetes API Server SSL certificate will expire after three months (instance {{ $labels.instance }})"
        description: "Kubernetes API Server SSL certificate expires in 90 daysn  VALUE = {{ $value }}n  LABELS: {{ $labels }}"
Useful links
Burimi: habr.com
