

В этой статье будет рассматриваться проект , который будет читать логи nginx, отправлять их в кластер Clickhouse. Обычно для логов используют ElasticSearch. Для Clickhouse требуется меньше ресурсов (дисковое пространство, ОЗУ, ЦПУ). Clickhouse быстрее записывает данные. Clickhouse сжимает данные, что делает данные на диске еще компактнее. Преимущества Clickhouse видны по 2 слайдам с доклада


Для просмотра аналитики по логам создадим дашборд для Grafana.
Кому интересно, добро пожаловать под кат.
Устанавливаем nginx, grafana стандартным способом.
Устанавливаем кластер clickhouse с помощью ansible-playbook от .
Создание бд и таблиц в Clickhouse
В этом описаны SQL запросы для создания бд и таблиц для nginx-log-collector в Clickhouse.
Каждый запрос делаем поочередно на каждом сервере кластера Clickhouse.
Важное замечание. В этой строке logs_cluster нужно заменить на ваше название кластера из файла clickhouse_remote_servers.xml между "remote_servers" and "shard".
ENGINE = Distributed('logs_cluster', 'nginx', 'access_log_shard', rand())Устанавливка и настройка nginx-log-collector-rpm
Nginx-log-collector не имеет rpm. Здесь создаем ему rpm. Собираться rpm будет с помощью
Устанавливаем rpm пакет nginx-log-collector-rpm
yum -y install yum-plugin-copr
yum copr enable antonpatsev/nginx-log-collector-rpm
yum -y install nginx-log-collector
systemctl start nginx-log-collector
Правим конфиг /etc/nginx-log-collector/config.yaml:
  .......
  upload:
    table: nginx.access_log
    dsn: http://ip-адрес-кластера-clickhouse:8123/

- tag: "nginx_error:"
  format: error  # access | error
  buffer_size: 1048576
  upload:
    table: nginx.error_log
    dsn: http://ip-адрес-кластера-clickhouse:8123/
Настройка nginx
Общий конфиг nginx:
user  nginx;
worker_processes  auto;

#error_log  /var/log/nginx/error.log warn;
pid        /var/run/nginx.pid;

events {
    worker_connections  1024;
}

http {
    include       /etc/nginx/mime.types;
    default_type  application/octet-stream;

    log_format  main  '$remote_addr - $remote_user [$time_local] "$request" '
                      '$status $body_bytes_sent "$http_referer" '
                      '"$http_user_agent" "$http_x_forwarded_for"';

    log_format avito_json escape=json
                     '{'
                     '"event_datetime": "$time_iso8601", '
                     '"server_name": "$server_name", '
                     '"remote_addr": "$remote_addr", '
                     '"remote_user": "$remote_user", '
                     '"http_x_real_ip": "$http_x_real_ip", '
                     '"status": "$status", '
                     '"scheme": "$scheme", '
                     '"request_method": "$request_method", '
                     '"request_uri": "$request_uri", '
                     '"server_protocol": "$server_protocol", '
                     '"body_bytes_sent": $body_bytes_sent, '
                     '"http_referer": "$http_referer", '
                     '"http_user_agent": "$http_user_agent", '
                     '"request_bytes": "$request_length", '
                     '"request_time": "$request_time", '
                     '"upstream_addr": "$upstream_addr", '
                     '"upstream_response_time": "$upstream_response_time", '
                     '"hostname": "$hostname", '
                     '"host": "$host"'
                     '}';

    access_log     syslog_server=unix:/var/run/nginx_log.sock,nohostname,tag=nginx avito_json; #ClickHouse
    error_log      syslog_server=unix:/var/run/nginx_log.sock,nohostname,tag=nginx_error; #ClickHouse

    #access_log  /var/log/nginx/access.log  main;

    proxy_ignore_client_abort on;
    sendfile        on;
    keepalive_timeout  65;
    include /etc/nginx/conf.d/*.conf;
}
Виртуальный хост один:
vhost1.conf:
upstream backend {
    server ip-адрес-сервера-с-stub_http_server:8080;
    server ip-адрес-сервера-с-stub_http_server:8080;
    server ip-адрес-сервера-с-stub_http_server:8080;
    server ip-адрес-сервера-с-stub_http_server:8080;
    server ip-адрес-сервера-с-stub_http_server:8080;
}

server {
    listen   80;
    server_name vhost1;
    location / {
        proxy_pass http://backend;
    }
}
Добавляем в файл /etc/hosts виртуальные хосты:
ip-адрес-сервера-с-nginx vhost1Эмулятор HTTP сервера
В качестве эмулятора HTTP сервера будем использовать nga
Nodejs-stub-server не имеет rpm. Здесь создаем ему rpm. Собираться rpm будет с помощью
Устанавливаем на upstream nginx rpm пакет nodejs-stub-server
yum -y install yum-plugin-copr
yum copr enable antonpatsev/nodejs-stub-server
yum -y install stub_http_server
systemctl start stub_http_server
Нагрузочное тестирование
Тестирование проводим с помощью Apache benchmark.
Устанавливаем его:
yum install -y httpd-toolsЗапускаем тестирование с помощью Apache benchmark c 5 разных серверов:
while true; do ab -H "User-Agent: 1server" -c 10 -n 10 -t 10 http://vhost1/; sleep 1; done
while true; do ab -H "User-Agent: 2server" -c 10 -n 10 -t 10 http://vhost1/; sleep 1; done
while true; do ab -H "User-Agent: 3server" -c 10 -n 10 -t 10 http://vhost1/; sleep 1; done
while true; do ab -H "User-Agent: 4server" -c 10 -n 10 -t 10 http://vhost1/; sleep 1; done
while true; do ab -H "User-Agent: 5server" -c 10 -n 10 -t 10 http://vhost1/; sleep 1; done
Настройка Grafana
На официальном сайте Grafana вы не найдете дашборд.
Поэтому будем делать его вручую.
Мой сохраненный дашборд вы можете найти .
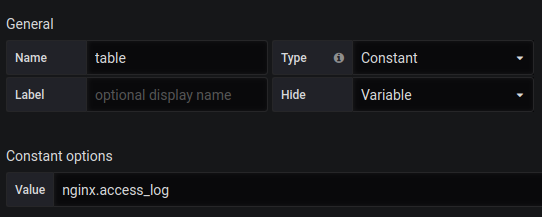
Так же вам нужно создать переменную table с содержимым nginx.access_log.
Singlestat Total Requests:
SELECT
 1 as t,
 count(*) as c
 FROM $table
 WHERE $timeFilter GROUP BY t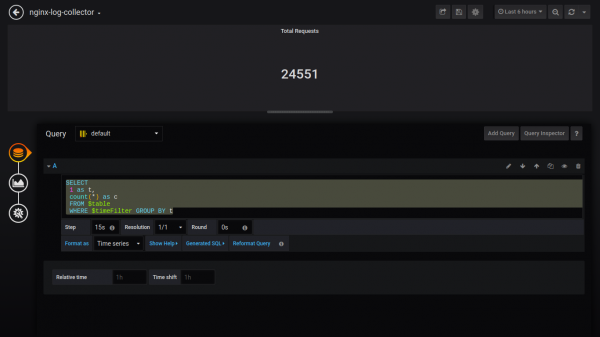
Singlestat Failed Requests:
SELECT
 1 as t,
 count(*) as c
 FROM $table
 WHERE $timeFilter AND status NOT IN (200, 201, 401) GROUP BY t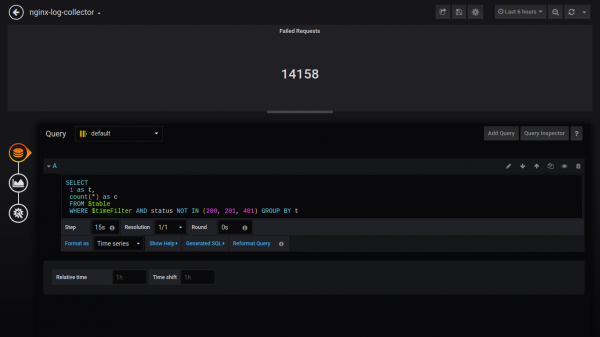
Singlestat Failing Percent:
SELECT
 1 as t, (sum(status = 500 or status = 499)/sum(status = 200 or status = 201 or status = 401))*100 FROM $table
 WHERE $timeFilter GROUP BY t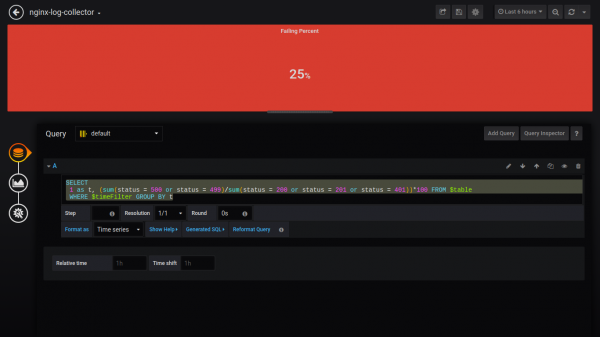
Singlestat Avg Response Time:
SELECT
 1, avg(request_time) FROM $table
 WHERE $timeFilter GROUP BY 1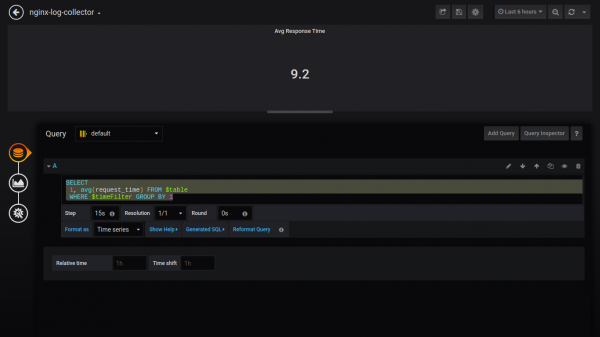
Singlestat Max Response Time:
SELECT
 1 as t, max(request_time) as c
 FROM $table
 WHERE $timeFilter GROUP BY t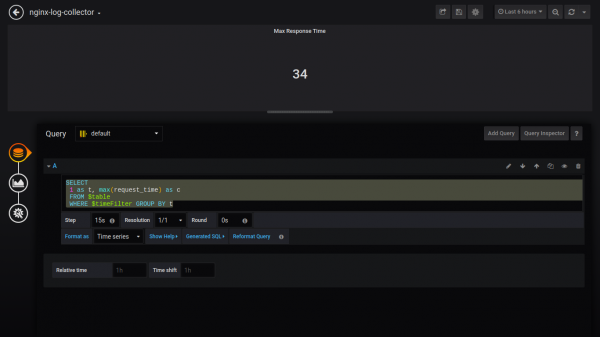
Count Status:
$columns(status, count(*) as c) from $table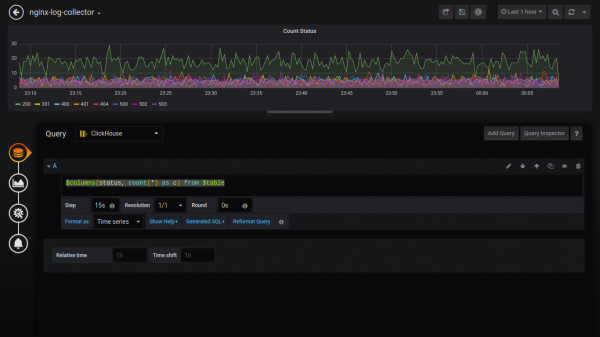
Для вывода данных как пирог, нужно установить плагин и перезагрузить grafana.
grafana-cli plugins install grafana-piechart-panel
service grafana-server restart
Pie TOP 5 Status:
SELECT
    1, /* fake timestamp value */
    status,
    sum(status) AS Reqs
FROM $table
WHERE $timeFilter
GROUP BY status
ORDER BY Reqs desc
LIMIT 5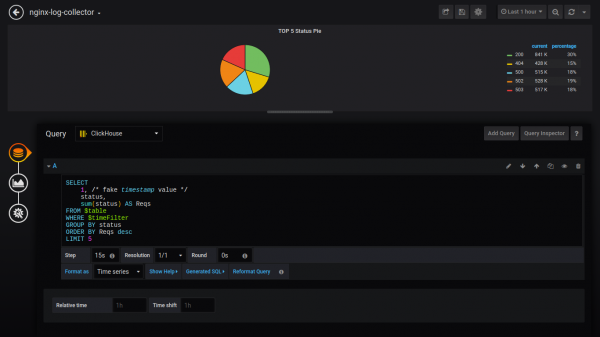
Дальше буду приводить запросы без скриншотов:
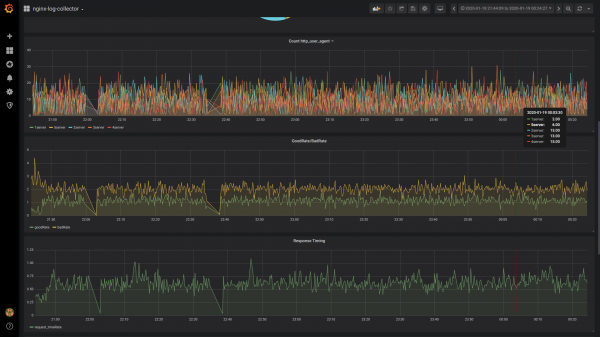
Count http_user_agent:
$columns(http_user_agent, count(*) c) FROM $tableGoodRate/BadRate:
$rate(countIf(status = 200) AS good, countIf(status != 200) AS bad) FROM $tableResponse Timing:
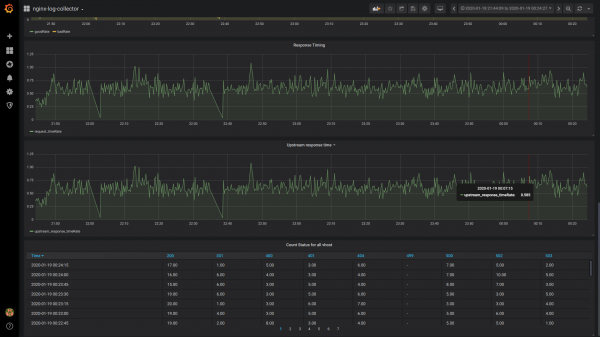
$rate(avg(request_time) as request_time) FROM $tableUpstream response time (время ответа 1-го upstream):
$rate(avg(arrayElement(upstream_response_time,1)) as upstream_response_time) FROM $tableTable Count Status for all vhost:
$columns(status, count(*) as c) from $tableОбщий вид дашборда

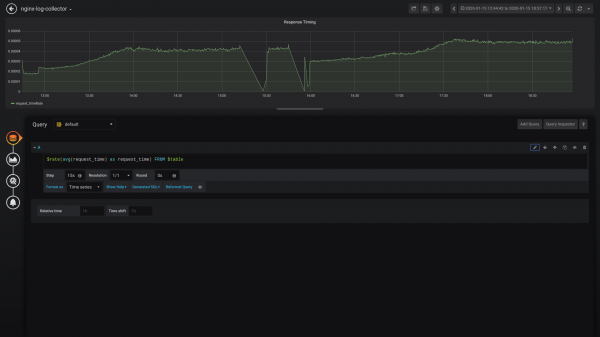
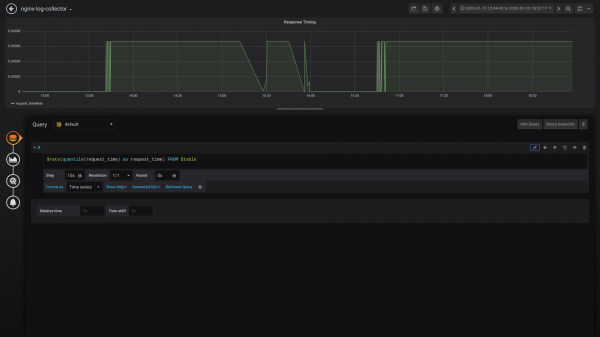
Сравнение avg() и quantile()
avg()
quantile()
Dalja:
Надеюсь, сообщество подключится к разработке/тестированию и использованию nginx-log-collector.
И кто-нибудь когда внедрит nginx-log-collector расскажет сколько сэкономил диска, ОЗУ, ЦПУ.
Telegram каналы:
Миллисекунды:
Кому важны миллисекунды, напишите или проголосуйте, пожалуйста, в этом .
Burimi: habr.com
