

บทความนี้จะกล่าวถึงโครงการ ซึ่งจะอ่านบันทึก nginx ส่งไปยังคลัสเตอร์ Clickhouse โดยปกติแล้ว ElasticSearch จะใช้สำหรับบันทึก Clickhouse ต้องการทรัพยากรน้อยลง (พื้นที่ดิสก์, RAM, CPU) Clickhouse เขียนข้อมูลเร็วขึ้น Clickhouse บีบอัดข้อมูล ซึ่งทำให้ข้อมูลบนดิสก์มีขนาดกะทัดรัดยิ่งขึ้น ประโยชน์ของ Clickhouse สามารถดูได้ใน 2 สไลด์จากรายงาน


หากต้องการดูการวิเคราะห์ตามบันทึก เรามาสร้างแดชบอร์ดสำหรับ Grafana กันดีกว่า
ใครสนใจยินดีต้อนรับสู่แมวครับ
ติดตั้ง nginx, grafana ด้วยวิธีมาตรฐาน
การติดตั้งคลัสเตอร์ clickhouse โดยใช้ ansible-playbook จาก .
การสร้างฐานข้อมูลและตารางใน Clickhouse
ในการนี้ มีการอธิบายแบบสอบถาม SQL สำหรับการสร้างฐานข้อมูลและตารางสำหรับ nginx-log-collector ใน Clickhouse
เราทำการร้องขอแต่ละครั้งบนแต่ละเซิร์ฟเวอร์ของคลัสเตอร์ Clickhouse
โน๊ตสำคัญ. ในบรรทัดนี้ ควรแทนที่ logs_cluster ด้วยชื่อคลัสเตอร์ของคุณจากไฟล์ clickhouse_remote_servers.xml ระหว่าง "remote_servers" และ "shard"
ENGINE = Distributed('logs_cluster', 'nginx', 'access_log_shard', rand())การติดตั้งและกำหนดค่า nginx-log-collector-rpm
Nginx-log-collector ไม่มีรอบต่อนาที ที่นี่ สร้าง rpm ให้มัน rpm จะถูกสร้างขึ้นโดยใช้
ติดตั้งแพ็คเกจ rpm nginx-log-collector-rpm
yum -y install yum-plugin-copr
yum copr enable antonpatsev/nginx-log-collector-rpm
yum -y install nginx-log-collector
systemctl start nginx-log-collector
แก้ไขการกำหนดค่า /etc/nginx-log-collector/config.yaml:
  .......
  upload:
    table: nginx.access_log
    dsn: http://ip-адрес-кластера-clickhouse:8123/

- tag: "nginx_error:"
  format: error  # access | error
  buffer_size: 1048576
  upload:
    table: nginx.error_log
    dsn: http://ip-адрес-кластера-clickhouse:8123/
การตั้งค่า nginx
การกำหนดค่า nginx ทั่วไป:
user  nginx;
worker_processes  auto;

#error_log  /var/log/nginx/error.log warn;
pid        /var/run/nginx.pid;

events {
    worker_connections  1024;
}

http {
    include       /etc/nginx/mime.types;
    default_type  application/octet-stream;

    log_format  main  '$remote_addr - $remote_user [$time_local] "$request" '
                      '$status $body_bytes_sent "$http_referer" '
                      '"$http_user_agent" "$http_x_forwarded_for"';

    log_format avito_json escape=json
                     '{'
                     '"event_datetime": "$time_iso8601", '
                     '"server_name": "$server_name", '
                     '"remote_addr": "$remote_addr", '
                     '"remote_user": "$remote_user", '
                     '"http_x_real_ip": "$http_x_real_ip", '
                     '"status": "$status", '
                     '"scheme": "$scheme", '
                     '"request_method": "$request_method", '
                     '"request_uri": "$request_uri", '
                     '"server_protocol": "$server_protocol", '
                     '"body_bytes_sent": $body_bytes_sent, '
                     '"http_referer": "$http_referer", '
                     '"http_user_agent": "$http_user_agent", '
                     '"request_bytes": "$request_length", '
                     '"request_time": "$request_time", '
                     '"upstream_addr": "$upstream_addr", '
                     '"upstream_response_time": "$upstream_response_time", '
                     '"hostname": "$hostname", '
                     '"host": "$host"'
                     '}';

    access_log     syslog_server=unix:/var/run/nginx_log.sock,nohostname,tag=nginx avito_json; #ClickHouse
    error_log      syslog_server=unix:/var/run/nginx_log.sock,nohostname,tag=nginx_error; #ClickHouse

    #access_log  /var/log/nginx/access.log  main;

    proxy_ignore_client_abort on;
    sendfile        on;
    keepalive_timeout  65;
    include /etc/nginx/conf.d/*.conf;
}
โฮสต์เสมือนที่หนึ่ง:
vhost1.conf:
upstream backend {
    server ip-адрес-сервера-с-stub_http_server:8080;
    server ip-адрес-сервера-с-stub_http_server:8080;
    server ip-адрес-сервера-с-stub_http_server:8080;
    server ip-адрес-сервера-с-stub_http_server:8080;
    server ip-адрес-сервера-с-stub_http_server:8080;
}

server {
    listen   80;
    server_name vhost1;
    location / {
        proxy_pass http://backend;
    }
}
เพิ่มโฮสต์เสมือนให้กับไฟล์ /etc/hosts:
ip-адрес-сервера-с-nginx vhost1โปรแกรมจำลองเซิร์ฟเวอร์ HTTP
เราจะใช้โปรแกรมจำลองเซิร์ฟเวอร์ HTTP จาก
nodejs-stub-server ไม่มี rpm ที่นี่ สร้าง rpm ให้มัน rpm จะถูกสร้างขึ้นโดยใช้
ติดตั้งแพ็คเกจ nodejs-stub-server บนอัปสตรีม nginx rpm
yum -y install yum-plugin-copr
yum copr enable antonpatsev/nodejs-stub-server
yum -y install stub_http_server
systemctl start stub_http_server
การทดสอบความเครียด
เราทำการทดสอบโดยใช้เกณฑ์มาตรฐาน Apache
ติดตั้ง:
yum install -y httpd-toolsเราเริ่มการทดสอบโดยใช้เกณฑ์มาตรฐาน Apache จากเซิร์ฟเวอร์ที่แตกต่างกัน 5 แห่ง:
while true; do ab -H "User-Agent: 1server" -c 10 -n 10 -t 10 http://vhost1/; sleep 1; done
while true; do ab -H "User-Agent: 2server" -c 10 -n 10 -t 10 http://vhost1/; sleep 1; done
while true; do ab -H "User-Agent: 3server" -c 10 -n 10 -t 10 http://vhost1/; sleep 1; done
while true; do ab -H "User-Agent: 4server" -c 10 -n 10 -t 10 http://vhost1/; sleep 1; done
while true; do ab -H "User-Agent: 5server" -c 10 -n 10 -t 10 http://vhost1/; sleep 1; done
การตั้งค่า Grafana
คุณจะไม่พบแดชบอร์ดบนเว็บไซต์ทางการของ Grafana
ดังนั้นเราจะทำด้วยมือ
คุณสามารถค้นหาแดชบอร์ดที่บันทึกไว้ของฉันได้ .
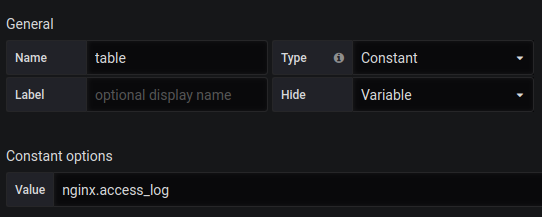
คุณต้องสร้างตัวแปรตารางพร้อมเนื้อหาด้วย nginx.access_log.
คำขอรวม Singlestat:
SELECT
 1 as t,
 count(*) as c
 FROM $table
 WHERE $timeFilter GROUP BY t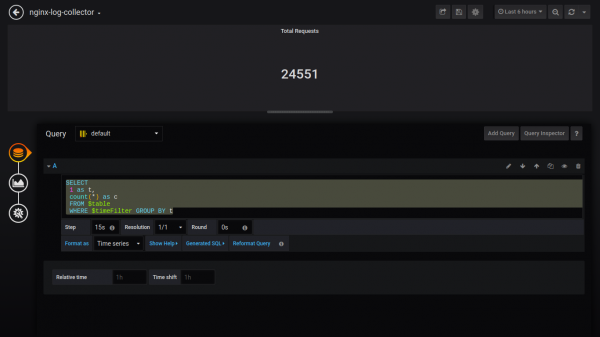
คำขอ Singlestat ล้มเหลว:
SELECT
 1 as t,
 count(*) as c
 FROM $table
 WHERE $timeFilter AND status NOT IN (200, 201, 401) GROUP BY t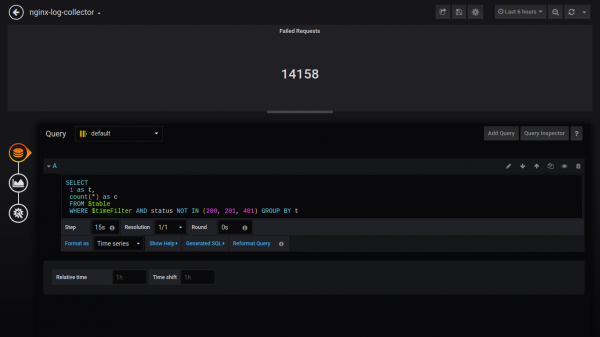
เปอร์เซ็นต์ความล้มเหลวของ Singlestat:
SELECT
 1 as t, (sum(status = 500 or status = 499)/sum(status = 200 or status = 201 or status = 401))*100 FROM $table
 WHERE $timeFilter GROUP BY t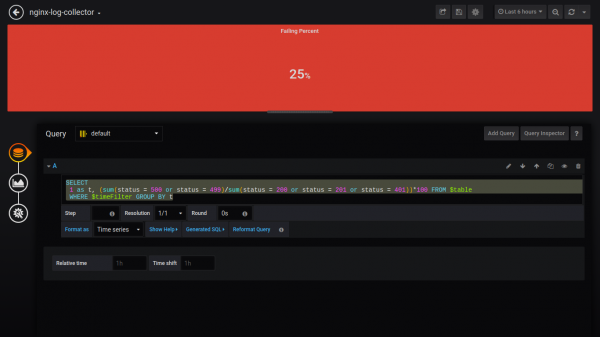
เวลาตอบสนองเฉลี่ยของ Singlestat:
SELECT
 1, avg(request_time) FROM $table
 WHERE $timeFilter GROUP BY 1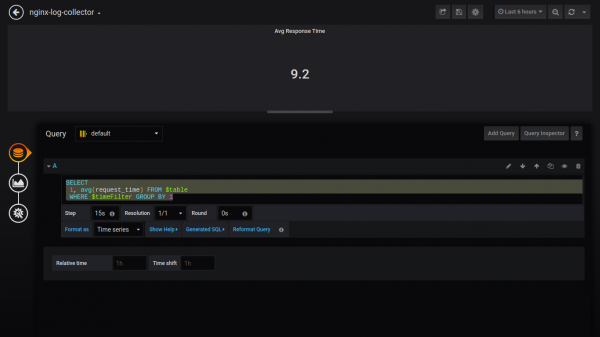
เวลาตอบสนองสูงสุดของ Singlestat:
SELECT
 1 as t, max(request_time) as c
 FROM $table
 WHERE $timeFilter GROUP BY t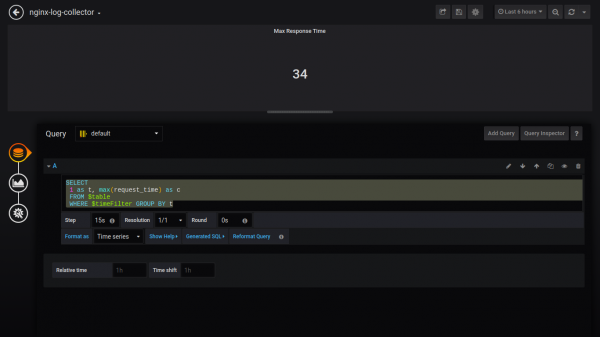
สถานะการนับ:
$columns(status, count(*) as c) from $table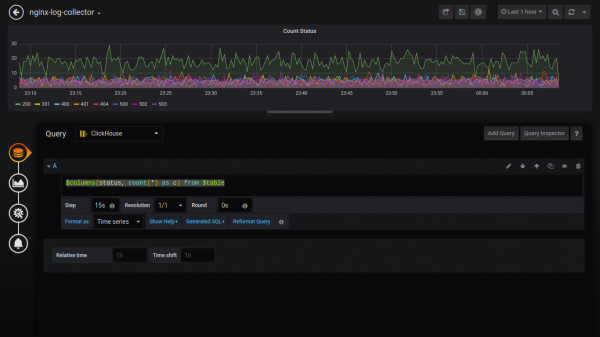
หากต้องการส่งออกข้อมูลเป็นพาย คุณต้องติดตั้งปลั๊กอินและโหลดกราฟาน่าอีกครั้ง
grafana-cli plugins install grafana-piechart-panel
service grafana-server restart
สถานะพาย TOP 5:
SELECT
    1, /* fake timestamp value */
    status,
    sum(status) AS Reqs
FROM $table
WHERE $timeFilter
GROUP BY status
ORDER BY Reqs desc
LIMIT 5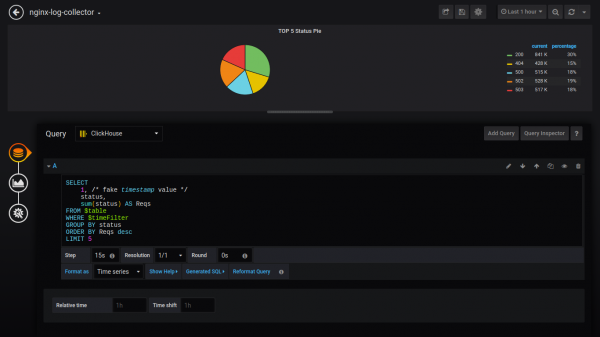
นอกจากนี้ ฉันจะส่งคำขอโดยไม่มีภาพหน้าจอ:
นับ http_user_agent:
$columns(http_user_agent, count(*) c) FROM $tableเรทดี/เรทไม่ดี:
$rate(countIf(status = 200) AS good, countIf(status != 200) AS bad) FROM $tableระยะเวลาตอบสนอง:
$rate(avg(request_time) as request_time) FROM $tableเวลาตอบสนองอัปสตรีม (เวลาตอบสนองของอัปสตรีมที่ 1):
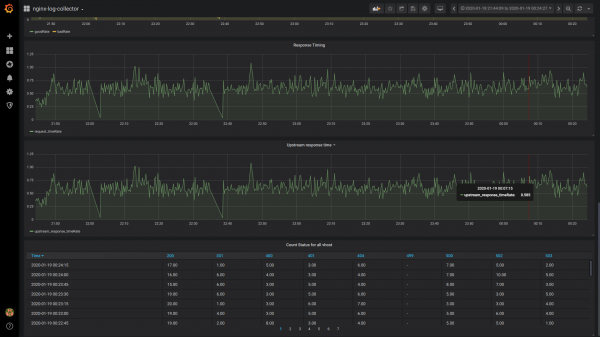
$rate(avg(arrayElement(upstream_response_time,1)) as upstream_response_time) FROM $tableสถานะการนับตารางสำหรับ vhost ทั้งหมด:
$columns(status, count(*) as c) from $tableมุมมองทั่วไปของแดชบอร์ด

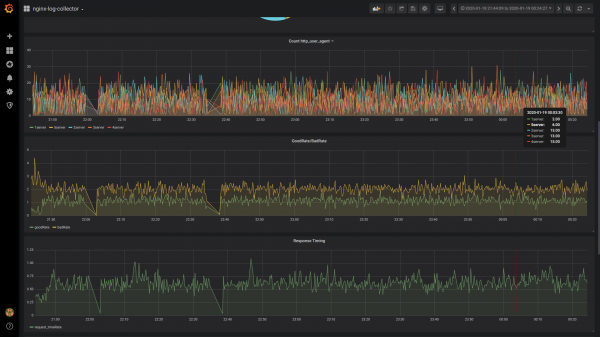
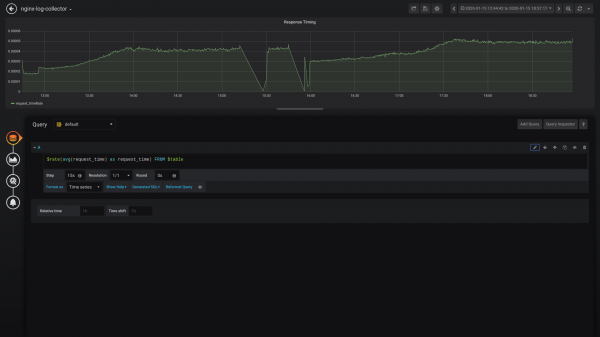
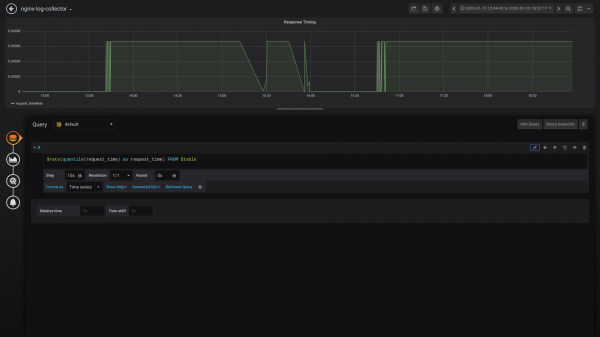
การเปรียบเทียบ avg() และ quantile()
เฉลี่ย ()
ปริมาณ()
สรุป:
หวังว่าชุมชนจะมีส่วนร่วมในการพัฒนา/ทดสอบและใช้งาน nginx-log-collector
และเมื่อมีคนใช้ nginx-log-collector เขาจะบอกคุณว่าเขาประหยัดดิสก์, RAM, CPU ได้มากแค่ไหน
ช่องทางโทรเลข:
มิลลิวินาที:
ใครสนใจเรื่องมิลลิวินาที เขียน หรือ โหวต ได้โปรด ในนี้ .
ที่มา: will.com
