

,旨在收集、转换和发送日志数据、指标和事件。
→
它是用 Rust 语言编写的,与同类产品相比,具有高性能和低 RAM 消耗的特点。 此外,与正确性相关的功能也受到了很多关注,特别是能够将未发送的事件保存到磁盘上的缓冲区并旋转文件。
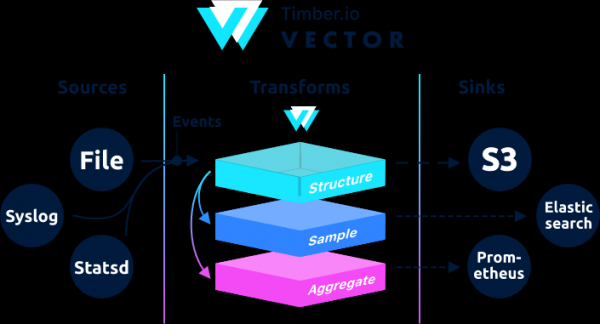
从架构上来说,Vector 是一个事件路由器,它从一个或多个接收消息 消息来源,可选地应用这些消息 转变,并将它们发送给一个或多个 排水沟.
Vector是filebeat和logstash的替代品,它可以充当两个角色(接收和发送日志),更多详细信息 .
如果在 Logstash 中链被构建为输入 → 过滤器 → 输出,那么在 Vector 中它是 → →
示例可以在文档中找到。
本指令是修订后的指令 。 原始指令包含 geoip 处理。 当从内部网络测试 geoip 时,向量给出了错误。
Aug 05 06:25:31.889 DEBUG transform{name=nginx_parse_rename_fields type=rename_fields}: vector::transforms::rename_fields: Field did not exist field=«geoip.country_name» rate_limit_secs=30如果有人需要处理 geoip,请参阅来自的原始说明 .
我们将在 Clickhouse 中和 Elasticsearch 中分别配置 Nginx(访问日志)→ Vector(客户端 | Filebeat)→ Vector(服务器 | Logstash)→ 的组合。 我们将安装 4 台服务器。 虽然你可以用 3 台服务器绕过它。
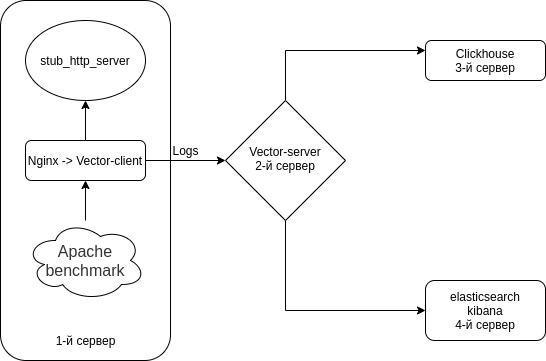
该计划是这样的。
在所有服务器上禁用 Selinux
sed -i 's/^SELINUX=.*/SELINUX=disabled/g' /etc/selinux/config
reboot
我们在所有服务器上安装 HTTP 服务器模拟器 + 实用程序
作为 HTTP 服务器模拟器,我们将使用 从
Nodejs-stub-server 没有 rpm。 为其创建 rpm。 rpm 将使用以下方式编译
添加 antonpatsev/nodejs-stub-server 存储库
yum -y install yum-plugin-copr epel-release
yes | yum copr enable antonpatsev/nodejs-stub-server
在所有服务器上安装nodejs-stub-server、Apache 基准测试和屏幕终端多路复用器
yum -y install stub_http_server screen mc httpd-tools screen我更正了 /var/lib/stub_http_server/stub_http_server.js 文件中的 stub_http_server 响应时间,以便有更多日志。
var max_sleep = 10;让我们启动stub_http_server。
systemctl start stub_http_server
systemctl enable stub_http_server在服务器 3 上
ClickHouse 使用 SSE 4.2 指令集,因此除非另有说明,否则所使用的处理器对其的支持将成为额外的系统要求。 以下是检查当前处理器是否支持 SSE 4.2 的命令:
grep -q sse4_2 /proc/cpuinfo && echo "SSE 4.2 supported" || echo "SSE 4.2 not supported"首先需要连接官方仓库:
sudo yum install -y yum-utils
sudo rpm --import https://repo.clickhouse.tech/CLICKHOUSE-KEY.GPG
sudo yum-config-manager --add-repo https://repo.clickhouse.tech/rpm/stable/x86_64
要安装软件包,您需要运行以下命令:
sudo yum install -y clickhouse-server clickhouse-client/etc/clickhouse-server/config.xml 文件中允许clickhouse-server监听网卡
<listen_host>0.0.0.0</listen_host>将日志记录级别从跟踪更改为调试
调试
标准压缩设置:
min_compress_block_size  65536
max_compress_block_size  1048576
要激活 Zstd 压缩,建议不要触及配置,而是使用 DDL。

我在 Google 中找不到如何通过 DDL 使用 zstd 压缩。 所以我保持原样。
在Clickhouse中使用zstd压缩的同事,请分享一下使用说明。
要将服务器作为守护进程启动,请运行:
service clickhouse-server start现在让我们继续设置 Clickhouse
前往点击之家
clickhouse-client -h 172.26.10.109 -m172.26.10.109 — 安装 Clickhouse 的服务器的 IP。
让我们创建一个矢量数据库
CREATE DATABASE vector;让我们检查一下数据库是否存在。
show databases;创建一个 vector.logs 表。
/* Это таблица где хранятся логи как есть */

CREATE TABLE vector.logs
(
    `node_name` String,
    `timestamp` DateTime,
    `server_name` String,
    `user_id` String,
    `request_full` String,
    `request_user_agent` String,
    `request_http_host` String,
    `request_uri` String,
    `request_scheme` String,
    `request_method` String,
    `request_length` UInt64,
    `request_time` Float32,
    `request_referrer` String,
    `response_status` UInt16,
    `response_body_bytes_sent` UInt64,
    `response_content_type` String,
    `remote_addr` IPv4,
    `remote_port` UInt32,
    `remote_user` String,
    `upstream_addr` IPv4,
    `upstream_port` UInt32,
    `upstream_bytes_received` UInt64,
    `upstream_bytes_sent` UInt64,
    `upstream_cache_status` String,
    `upstream_connect_time` Float32,
    `upstream_header_time` Float32,
    `upstream_response_length` UInt64,
    `upstream_response_time` Float32,
    `upstream_status` UInt16,
    `upstream_content_type` String,
    INDEX idx_http_host request_http_host TYPE set(0) GRANULARITY 1
)
ENGINE = MergeTree()
PARTITION BY toYYYYMMDD(timestamp)
ORDER BY timestamp
TTL timestamp + toIntervalMonth(1)
SETTINGS index_granularity = 8192;
我们检查表是否已创建。 让我们开始吧 clickhouse-client 并提出请求。
让我们进入矢量数据库。
use vector;

Ok.

0 rows in set. Elapsed: 0.001 sec.
让我们看一下表格。
show tables;

┌─name────────────────┐
│ logs                │
└─────────────────────┘
在第4台服务器上安装elasticsearch,将相同的数据发送到Elasticsearch与Clickhouse进行比较
添加 rpm 公钥
rpm --import https://artifacts.elastic.co/GPG-KEY-elasticsearch让我们创建 2 个存储库:
/etc/yum.repos.d/elasticsearch.repo
[elasticsearch]
name=Elasticsearch repository for 7.x packages
baseurl=https://artifacts.elastic.co/packages/7.x/yum
gpgcheck=1
gpgkey=https://artifacts.elastic.co/GPG-KEY-elasticsearch
enabled=0
autorefresh=1
type=rpm-md
/etc/yum.repos.d/kibana.repo
[kibana-7.x]
name=Kibana repository for 7.x packages
baseurl=https://artifacts.elastic.co/packages/7.x/yum
gpgcheck=1
gpgkey=https://artifacts.elastic.co/GPG-KEY-elasticsearch
enabled=1
autorefresh=1
type=rpm-md
安装elasticsearch和kibana
yum install -y kibana elasticsearch由于它将包含 1 个副本,因此您需要将以下内容添加到 /etc/elasticsearch/elasticsearch.yml 文件中:
discovery.type: single-node为了使该向量可以从另一台服务器将数据发送到elasticsearch,让我们更改network.host。
network.host: 0.0.0.0要连接到 kibana,请更改文件 /etc/kibana/kibana.yml 中的 server.host 参数
server.host: "0.0.0.0"旧的并且在自动启动中包含elasticsearch
systemctl enable elasticsearch
systemctl start elasticsearch
和基巴纳
systemctl enable kibana
systemctl start kibana
将Elasticsearch配置为单节点模式1个分片,0个副本。 您很可能拥有一个由大量服务器组成的集群,但您不需要这样做。
对于未来的索引,更新默认模板:
curl -X PUT http://localhost:9200/_template/default -H 'Content-Type: application/json' -d '{"index_patterns": ["*"],"order": -1,"settings": {"number_of_shards": "1","number_of_replicas": "0"}}' 安装 作为服务器 2 上 Logstash 的替代品
yum install -y https://packages.timber.io/vector/0.9.X/vector-x86_64.rpm mc httpd-tools screen让我们设置 Vector 作为 Logstash 的替代品。 编辑文件 /etc/vector/vector.toml
# /etc/vector/vector.toml

data_dir = "/var/lib/vector"

[sources.nginx_input_vector]
  # General
  type                          = "vector"
  address                       = "0.0.0.0:9876"
  shutdown_timeout_secs         = 30

[transforms.nginx_parse_json]
  inputs                        = [ "nginx_input_vector" ]
  type                          = "json_parser"

[transforms.nginx_parse_add_defaults]
  inputs                        = [ "nginx_parse_json" ]
  type                          = "lua"
  version                       = "2"

  hooks.process = """
  function (event, emit)

    function split_first(s, delimiter)
      result = {};
      for match in (s..delimiter):gmatch("(.-)"..delimiter) do
          table.insert(result, match);
      end
      return result[1];
    end

    function split_last(s, delimiter)
      result = {};
      for match in (s..delimiter):gmatch("(.-)"..delimiter) do
          table.insert(result, match);
      end
      return result[#result];
    end

    event.log.upstream_addr             = split_first(split_last(event.log.upstream_addr, ', '), ':')
    event.log.upstream_bytes_received   = split_last(event.log.upstream_bytes_received, ', ')
    event.log.upstream_bytes_sent       = split_last(event.log.upstream_bytes_sent, ', ')
    event.log.upstream_connect_time     = split_last(event.log.upstream_connect_time, ', ')
    event.log.upstream_header_time      = split_last(event.log.upstream_header_time, ', ')
    event.log.upstream_response_length  = split_last(event.log.upstream_response_length, ', ')
    event.log.upstream_response_time    = split_last(event.log.upstream_response_time, ', ')
    event.log.upstream_status           = split_last(event.log.upstream_status, ', ')

    if event.log.upstream_addr == "" then
        event.log.upstream_addr = "127.0.0.1"
    end

    if (event.log.upstream_bytes_received == "-" or event.log.upstream_bytes_received == "") then
        event.log.upstream_bytes_received = "0"
    end

    if (event.log.upstream_bytes_sent == "-" or event.log.upstream_bytes_sent == "") then
        event.log.upstream_bytes_sent = "0"
    end

    if event.log.upstream_cache_status == "" then
        event.log.upstream_cache_status = "DISABLED"
    end

    if (event.log.upstream_connect_time == "-" or event.log.upstream_connect_time == "") then
        event.log.upstream_connect_time = "0"
    end

    if (event.log.upstream_header_time == "-" or event.log.upstream_header_time == "") then
        event.log.upstream_header_time = "0"
    end

    if (event.log.upstream_response_length == "-" or event.log.upstream_response_length == "") then
        event.log.upstream_response_length = "0"
    end

    if (event.log.upstream_response_time == "-" or event.log.upstream_response_time == "") then
        event.log.upstream_response_time = "0"
    end

    if (event.log.upstream_status == "-" or event.log.upstream_status == "") then
        event.log.upstream_status = "0"
    end

    emit(event)

  end
  """

[transforms.nginx_parse_remove_fields]
    inputs                              = [ "nginx_parse_add_defaults" ]
    type                                = "remove_fields"
    fields                              = ["data", "file", "host", "source_type"]

[transforms.nginx_parse_coercer]

    type                                = "coercer"
    inputs                              = ["nginx_parse_remove_fields"]

    types.request_length = "int"
    types.request_time = "float"

    types.response_status = "int"
    types.response_body_bytes_sent = "int"

    types.remote_port = "int"

    types.upstream_bytes_received = "int"
    types.upstream_bytes_send = "int"
    types.upstream_connect_time = "float"
    types.upstream_header_time = "float"
    types.upstream_response_length = "int"
    types.upstream_response_time = "float"
    types.upstream_status = "int"

    types.timestamp = "timestamp"

[sinks.nginx_output_clickhouse]
    inputs   = ["nginx_parse_coercer"]
    type     = "clickhouse"

    database = "vector"
    healthcheck = true
    host = "http://172.26.10.109:8123" #  Адрес Clickhouse
    table = "logs"

    encoding.timestamp_format = "unix"

    buffer.type = "disk"
    buffer.max_size = 104900000
    buffer.when_full = "block"

    request.in_flight_limit = 20

[sinks.elasticsearch]
    type = "elasticsearch"
    inputs   = ["nginx_parse_coercer"]
    compression = "none"
    healthcheck = true
    # 172.26.10.116 - сервер где установен elasticsearch
    host = "http://172.26.10.116:9200"
    index = "vector-%Y-%m-%d"
您可以调整transforms.nginx_parse_add_defaults部分。
如 将这些配置用于小型 CDN,upstream_* 中可以有多个值
例如:
"upstream_addr": "128.66.0.10:443, 128.66.0.11:443, 128.66.0.12:443"
"upstream_bytes_received": "-, -, 123"
"upstream_status": "502, 502, 200"
如果这不是您的情况,那么这部分可以简化
让我们为 systemd 创建服务设置 /etc/systemd/system/vector.service
# /etc/systemd/system/vector.service

[Unit]
Description=Vector
After=network-online.target
Requires=network-online.target

[Service]
User=vector
Group=vector
ExecStart=/usr/bin/vector
ExecReload=/bin/kill -HUP $MAINPID
Restart=no
StandardOutput=syslog
StandardError=syslog
SyslogIdentifier=vector

[Install]
WantedBy=multi-user.target
创建表后,您可以运行Vector
systemctl enable vector
systemctl start vector
矢量日志可以这样查看:
journalctl -f -u vector日志中应该有这样的条目
INFO vector::topology::builder: Healthcheck: Passed.
INFO vector::topology::builder: Healthcheck: Passed.
在客户端(Web 服务器)上 - 第一个服务器
在带有 nginx 的服务器上,您需要禁用 ipv6,因为 clickhouse 中的日志表使用该字段 upstream_addr IPv4,因为我不在网络内使用 ipv6。 如果不关闭ipv6,会出现错误:
DB::Exception: Invalid IPv4 value.: (while read the value of key upstream_addr)也许读者们,添加 ipv6 支持。
创建文件 /etc/sysctl.d/98-disable-ipv6.conf
net.ipv6.conf.all.disable_ipv6 = 1
net.ipv6.conf.default.disable_ipv6 = 1
net.ipv6.conf.lo.disable_ipv6 = 1
应用设置
sysctl --system让我们安装 nginx。
添加了 nginx 存储库文件 /etc/yum.repos.d/nginx.repo
[nginx-stable]
name=nginx stable repo
baseurl=http://nginx.org/packages/centos/$releasever/$basearch/
gpgcheck=1
enabled=1
gpgkey=https://nginx.org/keys/nginx_signing.key
module_hotfixes=true
安装 nginx 包
yum install -y nginx首先,我们需要在文件/etc/nginx/nginx.conf中配置Nginx中的日志格式
user  nginx;
# you must set worker processes based on your CPU cores, nginx does not benefit from setting more than that
worker_processes auto; #some last versions calculate it automatically

# number of file descriptors used for nginx
# the limit for the maximum FDs on the server is usually set by the OS.
# if you don't set FD's then OS settings will be used which is by default 2000
worker_rlimit_nofile 100000;

error_log  /var/log/nginx/error.log warn;
pid        /var/run/nginx.pid;

# provides the configuration file context in which the directives that affect connection processing are specified.
events {
    # determines how much clients will be served per worker
    # max clients = worker_connections * worker_processes
    # max clients is also limited by the number of socket connections available on the system (~64k)
    worker_connections 4000;

    # optimized to serve many clients with each thread, essential for linux -- for testing environment
    use epoll;

    # accept as many connections as possible, may flood worker connections if set too low -- for testing environment
    multi_accept on;
}

http {
    include       /etc/nginx/mime.types;
    default_type  application/octet-stream;

    log_format  main  '$remote_addr - $remote_user [$time_local] "$request" '
                      '$status $body_bytes_sent "$http_referer" '
                      '"$http_user_agent" "$http_x_forwarded_for"';

log_format vector escape=json
    '{'
        '"node_name":"nginx-vector",'
        '"timestamp":"$time_iso8601",'
        '"server_name":"$server_name",'
        '"request_full": "$request",'
        '"request_user_agent":"$http_user_agent",'
        '"request_http_host":"$http_host",'
        '"request_uri":"$request_uri",'
        '"request_scheme": "$scheme",'
        '"request_method":"$request_method",'
        '"request_length":"$request_length",'
        '"request_time": "$request_time",'
        '"request_referrer":"$http_referer",'
        '"response_status": "$status",'
        '"response_body_bytes_sent":"$body_bytes_sent",'
        '"response_content_type":"$sent_http_content_type",'
        '"remote_addr": "$remote_addr",'
        '"remote_port": "$remote_port",'
        '"remote_user": "$remote_user",'
        '"upstream_addr": "$upstream_addr",'
        '"upstream_bytes_received": "$upstream_bytes_received",'
        '"upstream_bytes_sent": "$upstream_bytes_sent",'
        '"upstream_cache_status":"$upstream_cache_status",'
        '"upstream_connect_time":"$upstream_connect_time",'
        '"upstream_header_time":"$upstream_header_time",'
        '"upstream_response_length":"$upstream_response_length",'
        '"upstream_response_time":"$upstream_response_time",'
        '"upstream_status": "$upstream_status",'
        '"upstream_content_type":"$upstream_http_content_type"'
    '}';

    access_log  /var/log/nginx/access.log  main;
    access_log  /var/log/nginx/access.json.log vector;      # Новый лог в формате json

    sendfile        on;
    #tcp_nopush     on;

    keepalive_timeout  65;

    #gzip  on;

    include /etc/nginx/conf.d/*.conf;
}
为了不破坏你当前的配置,Nginx 允许你有几个 access_log 指令
access_log  /var/log/nginx/access.log  main;            # Стандартный лог
access_log  /var/log/nginx/access.json.log vector;      # Новый лог в формате json
不要忘记为新日志添加 logrotate 规则(如果日志文件不以 .log 结尾)
从 /etc/nginx/conf.d/ 中删除 default.conf
rm -f /etc/nginx/conf.d/default.conf添加虚拟主机 /etc/nginx/conf.d/vhost1.conf
server {
    listen 80;
    server_name vhost1;
    location / {
        proxy_pass http://172.26.10.106:8080;
    }
}
添加虚拟主机 /etc/nginx/conf.d/vhost2.conf
server {
    listen 80;
    server_name vhost2;
    location / {
        proxy_pass http://172.26.10.108:8080;
    }
}
添加虚拟主机 /etc/nginx/conf.d/vhost3.conf
server {
    listen 80;
    server_name vhost3;
    location / {
        proxy_pass http://172.26.10.109:8080;
    }
}
添加虚拟主机 /etc/nginx/conf.d/vhost4.conf
server {
    listen 80;
    server_name vhost4;
    location / {
        proxy_pass http://172.26.10.116:8080;
    }
}
将所有服务器的虚拟主机(安装nginx的服务器的172.26.10.106 ip)添加到/etc/hosts文件中:
172.26.10.106 vhost1
172.26.10.106 vhost2
172.26.10.106 vhost3
172.26.10.106 vhost4
如果一切准备就绪
nginx -t
systemctl restart nginx
现在我们自己安装一下
yum install -y https://packages.timber.io/vector/0.9.X/vector-x86_64.rpm让我们为 systemd 创建一个设置文件 /etc/systemd/system/vector.service
[Unit]
Description=Vector
After=network-online.target
Requires=network-online.target

[Service]
User=vector
Group=vector
ExecStart=/usr/bin/vector
ExecReload=/bin/kill -HUP $MAINPID
Restart=no
StandardOutput=syslog
StandardError=syslog
SyslogIdentifier=vector

[Install]
WantedBy=multi-user.target
并在 /etc/vector/vector.toml 配置中配置 Filebeat 替换。 IP地址172.26.10.108是日志服务器(Vector-Server)的IP地址
data_dir = "/var/lib/vector"

[sources.nginx_file]
  type                          = "file"
  include                       = [ "/var/log/nginx/access.json.log" ]
  start_at_beginning            = false
  fingerprinting.strategy       = "device_and_inode"

[sinks.nginx_output_vector]
  type                          = "vector"
  inputs                        = [ "nginx_file" ]

  address                       = "172.26.10.108:9876"
别忘了将用户向量添加到相应的组,以便它可以读取日志文件。例如,nginx 在 centos 创建具有管理员组权限的日志。
usermod -a -G adm vector让我们启动矢量服务
systemctl enable vector
systemctl start vector
矢量日志可以这样查看:
journalctl -f -u vector日志中应该有这样的条目
INFO vector::topology::builder: Healthcheck: Passed.压力测试
我们使用 Apache 基准测试进行测试。
httpd-tools 软件包已安装在所有服务器上
我们开始使用 Apache 基准测试从屏幕上的 4 个不同服务器进行测试。 首先,我们启动屏幕终端多路复用器,然后开始使用 Apache 基准测试。 如何使用屏幕,您可以在以下位置找到 .
从第一台服务器
while true; do ab -H "User-Agent: 1server" -c 100 -n 10 -t 10 http://vhost1/; sleep 1; done从第一台服务器
while true; do ab -H "User-Agent: 2server" -c 100 -n 10 -t 10 http://vhost2/; sleep 1; done从第一台服务器
while true; do ab -H "User-Agent: 3server" -c 100 -n 10 -t 10 http://vhost3/; sleep 1; done从第一台服务器
while true; do ab -H "User-Agent: 4server" -c 100 -n 10 -t 10 http://vhost4/; sleep 1; done我们来看看Clickhouse中的数据
前往点击之家
clickhouse-client -h 172.26.10.109 -m进行 SQL 查询
SELECT * FROM vector.logs;

┌─node_name────┬───────────timestamp─┬─server_name─┬─user_id─┬─request_full───┬─request_user_agent─┬─request_http_host─┬─request_uri─┬─request_scheme─┬─request_method─┬─request_length─┬─request_time─┬─request_referrer─┬─response_status─┬─response_body_bytes_sent─┬─response_content_type─┬───remote_addr─┬─remote_port─┬─remote_user─┬─upstream_addr─┬─upstream_port─┬─upstream_bytes_received─┬─upstream_bytes_sent─┬─upstream_cache_status─┬─upstream_connect_time─┬─upstream_header_time─┬─upstream_response_length─┬─upstream_response_time─┬─upstream_status─┬─upstream_content_type─┐
│ nginx-vector │ 2020-08-07 04:32:42 │ vhost1      │         │ GET / HTTP/1.0 │ 1server            │ vhost1            │ /           │ http           │ GET            │             66 │        0.028 │                  │             404 │                       27 │                       │ 172.26.10.106 │       45886 │             │ 172.26.10.106 │             0 │                     109 │                  97 │ DISABLED              │                     0 │                0.025 │                       27 │                  0.029 │             404 │                       │
└──────────────┴─────────────────────┴─────────────┴─────────┴────────────────┴────────────────────┴───────────────────┴─────────────┴────────────────┴────────────────┴────────────────┴──────────────┴──────────────────┴─────────────────┴──────────────────────────┴───────────────────────┴───────────────┴─────────────┴─────────────┴───────────────┴───────────────┴─────────────────────────┴─────────────────────┴───────────────────────┴───────────────────────┴──────────────────────┴──────────────────────────┴────────────────────────┴─────────────────┴───────────────────────
找出 Clickhouse 中表格的大小
select concat(database, '.', table)                         as table,
       formatReadableSize(sum(bytes))                       as size,
       sum(rows)                                            as rows,
       max(modification_time)                               as latest_modification,
       sum(bytes)                                           as bytes_size,
       any(engine)                                          as engine,
       formatReadableSize(sum(primary_key_bytes_in_memory)) as primary_keys_size
from system.parts
where active
group by database, table
order by bytes_size desc;
我们来看看 Clickhouse 占用了多少日志。
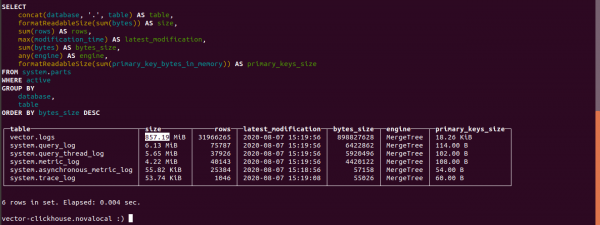
日志表大小为 857.19 MB。
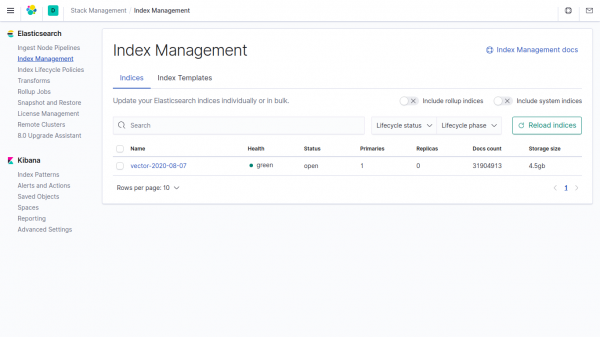
Elasticsearch 中索引中相同数据的大小为 4,5GB。
如果你没有在参数中指定向量中的数据,Clickhouse 比 Elasticsearch 中占用的资源少 4500/857.19 = 5.24 倍。
在向量中,默认使用压缩字段。
电报聊天者
电报聊天者
电报聊天通过“"
来源: habr.com
