

We use microservice architecture in our projects. When performance bottlenecks occur, a lot of time is spent monitoring and parsing logs. When logging the timings of individual operations to a log file, it is usually difficult to understand what led to the invocation of these operations, to track the sequence of actions or the time shift of one operation relative to another in different services.
To minimize manual labor, we decided to use one of the tracing tools. About how and why you can use tracing and how we did it, and will be discussed in this article.
What problems can be solved with tracing
- Find performance bottlenecks both within a single service and in the entire execution tree between all participating services. For example:
- Many short consecutive calls between services, for example, to geocoding or to a database.
- Long I/O waits, such as network transfers or disk reads.
- Long data parsing.
- Long operations requiring cpu.
- Sections of code that are not needed to get the final result and can be removed or delayed.
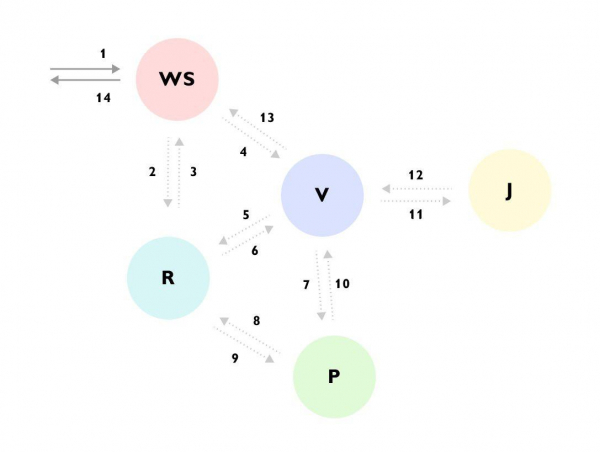
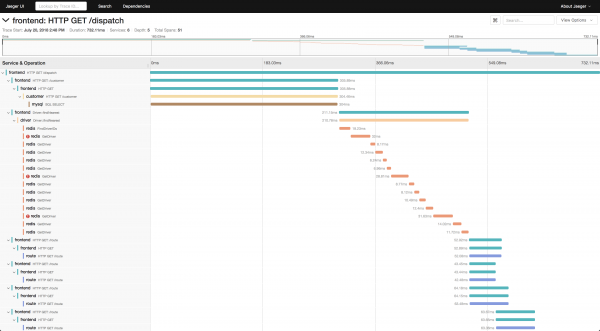
- Clearly understand in what sequence what is called and what happens when the operation is performed.

It can be seen that, for example, the Request came to the WS service -> the WS service supplemented the data through the R service -> then sent a request to the V service -> the V service loaded a lot of data from the R service -> went to the P service -> the P service went again to service R -> service V ignored the result and went to service J -> and only then returned the response to service WS, while continuing to calculate something else in the background.
Without such a trace or detailed documentation for the entire process, it is very difficult to understand what is happening when looking at the code for the first time, and the code is scattered across different services and hidden behind a bunch of bins and interfaces. - Collection of information about the execution tree for subsequent deferred analysis. At each stage of execution, you can add information to the trace that is available at this stage and then figure out what input data led to a similar scenario. For example:
- User ID
- Law
- Type of selected method
- Log or execution error
- Turning traces into a subset of metrics and further analysis already in the form of metrics.
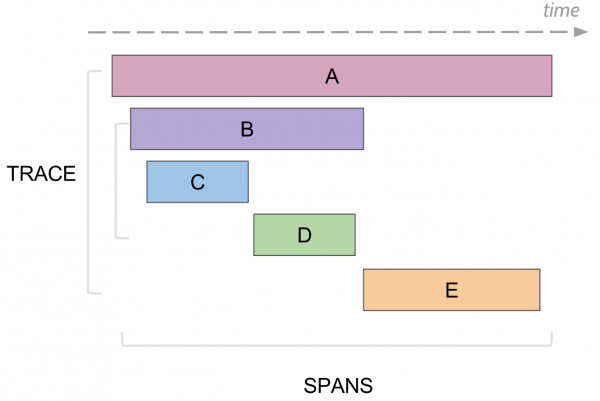
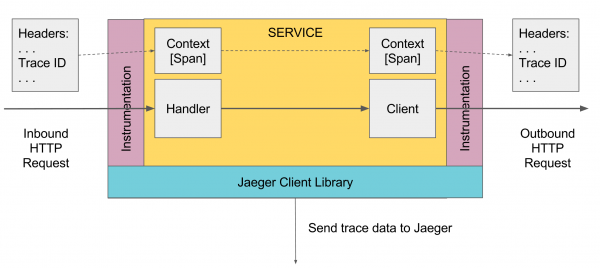
What trace can log. Span
In tracing there is the concept of a span, this is an analogue of one log, to the console. The spa has:
- Name, usually the name of the method that was executed
- The name of the service in which the span was generated
- Own unique ID
- Some kind of meta information in the form of a key/value that has been logged into it. For example, method parameters or the method ended with an error or not
- Start and end times for this span
- Parent span ID
Each span is sent to the span collector to be stored in the database for later review as soon as it has completed its execution. In the future, you can build a tree of all spans by connecting by parent id. When analyzing, you can find, for example, all the spans in some service that took more than some time. Further, by going to a specific span, see the entire tree above and below this span.
Opentrace, Jagger and how we implemented it for our projects
There is a common standard , which describes how and what should be collected, without being tied by tracing to a specific implementation in any language. For example, in Java, all work with traces is carried out through the common Opentrace API, and under it, for example, Jaeger or an empty default implementation that does nothing can be hidden.
We are using as an implementation of Opentrace. It consists of several components:
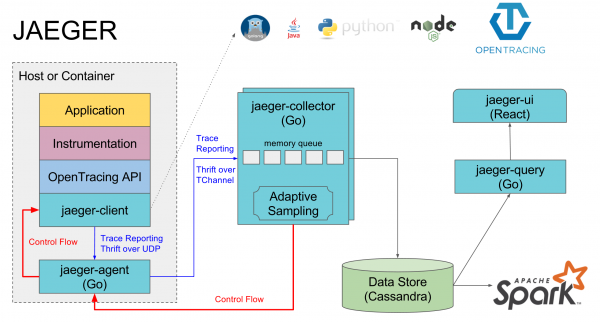
- Jaeger-agent is a local agent that is usually installed on each machine and services are logged into it on the local default port. If there is no agent, then traces of all services on this machine are usually disabled
- Jaeger-collector - all agents send collected traces to it, and it puts them in the selected database
- The database is their preferred cassandra, but we use elasticsearch, there are implementations for a couple of other databases and an in-memory implementation that does not save anything to disk
- Jaeger-query is a service that goes to the database and returns already collected traces for analysis
- Jaeger-ui is a web interface for searching and viewing traces, it goes to jaeger-query
A separate component can be called the implementation of opentrace jaeger for specific languages, through which spans are sent to jaeger-agent.
comes down to implementing the io.opentracing.Tracer interface, after which all traces through it will fly to the real agent.
Also for the spring component, you can connect and implementation from Jaeger which will automatically configure tracing for everything that passes through these components, for example http requests to controllers, requests to the database through jdbc, etc.
Traces logging in Java
Somewhere at the top level, the first Span must be created, this can be done automatically, for example, by the spring controller when a request is received, or manually if there is none. It is then transmitted through the Scope below. If any of the methods below want to add a Span, it takes the current activeSpan from the Scope, creates a new Span and says its parent is the resulting activeSpan, and makes the new Span active. When calling external services, the current active span is passed to them, and those services create new spans with reference to this span.
All work goes through the Tracer instance, you can get it through the DI mechanism, or GlobalTracer.get () as a global variable if the DI mechanism does not work. By default, if tracer has not been initialized, NoopTracer will return which does nothing.
Further, the current scope is obtained from the tracer through the ScopeManager, a new scope is created from the current one with a binding of the new span, and then the created Scope is closed, which closes the created span and returns the previous Scope to the active state. Scope is tied to a thread, so when multi-threaded programming, you must not forget to transfer the active span to another thread, for further activation of the Scope of another thread with reference to this span.
io.opentracing.Tracer tracer = ...; // GlobalTracer.get()

void DoSmth () {
   try (Scope scope = tracer.buildSpan("DoSmth").startActive(true)) {
      ...
   }
}
void DoOther () {
    Span span = tracer.buildSpan("someWork").start();
    try (Scope scope = tracer.scopeManager().activate(span, false)) {
        // Do things.
    } catch(Exception ex) {
        Tags.ERROR.set(span, true);
        span.log(Map.of(Fields.EVENT, "error", Fields.ERROR_OBJECT, ex, Fields.MESSAGE, ex.getMessage()));
    } finally {
        span.finish();
    }
}

void DoAsync () {
    try (Scope scope = tracer.buildSpan("ServiceHandlerSpan").startActive(false)) {
        ...
        final Span span = scope.span();
        doAsyncWork(() -> {
            // STEP 2 ABOVE: reactivate the Span in the callback, passing true to
            // startActive() if/when the Span must be finished.
            try (Scope scope = tracer.scopeManager().activate(span, false)) {
                ...
            }
        });
    }
}
For multi-threaded programming, there is also TracedExecutorService and similar wrappers that automatically forward the current span to the thread when asynchronous tasks are launched:
private ExecutorService executor = new TracedExecutorService(
    Executors.newFixedThreadPool(10), GlobalTracer.get()
);
For external http requests there is
HttpClient httpClient = new TracingHttpClientBuilder().build();Problems we faced
- Beans and DI do not always work if the tracer is not used in a service or component, then Tracer may not work and you will have to use GlobalTracer.get().
- Annotations do not work if it is not a component or service, or if the method is called from a neighboring method of the same class. You have to be careful to check what works and use manual trace creation if @Traced doesn't work. You can also attach an additional compiler for java annotations, then they should work everywhere.
- In the old spring and spring boot, the opentraing spring cloud autoconfiguration does not work due to bugs in DI, then if you want the traces in the spring components to work automatically, you can do it by analogy with
- Try with resources does not work in groovy, you must use try finally.
- Each service must have its own spring.application.name under which traces will be logged. What does a separate name for the sale and the test, so as not to interfere with them together.
- If you use GlobalTracer and tomcat, then all services running in this tomcat have one GlobalTracer, so they will all have the same service name.
- When adding traces to a method, you need to be sure that it is not called many times in a loop. It is necessary to add one common trace for all calls, which guarantees the total work time. Otherwise, an excess load will be created.
- Once in jaeger-ui, too large requests were made for a large number of traces, and since they did not wait for a response, they did it again. As a result, jaeger-query began to eat a lot of memory and slow down elastic. Helped by restarting jaeger-query
Sampling, storing and viewing traces
There are three types :
- Const which sends and saves all traces.
- Probabilistic which filters traces with some given probability.
- Ratelimiting which limits the number of traces per second. You can configure these settings on the client, either on the jaeger-agent or on the collector. Now we use const 1 in the valuator stack, since there are not very many requests, but they take a long time. In the future, if this will exert an excessive load on the system, you can limit it.
If you use cassandra, then by default it only stores traces for two days. We are using and traces are stored for all time and are not deleted. A separate index is created for each day, for example jaeger-service-2019-03-04. In the future, you need to configure automatic cleaning of old traces.
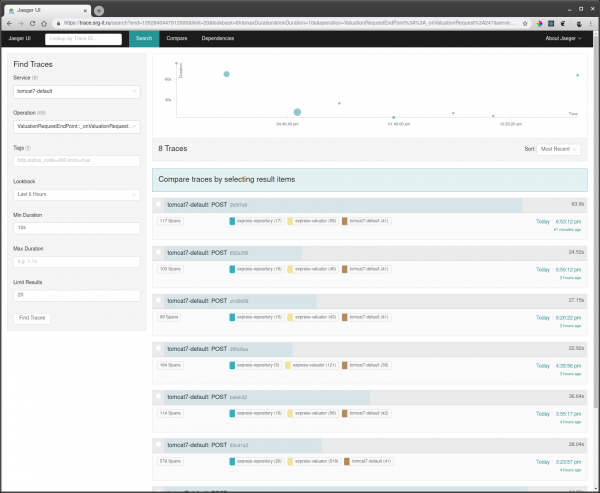
In order to view the traces you need:
- Select the service by which you want to filter traces, for example, tomcat7-default for a service that is running in the tomcat and cannot have its own name.
- Then select the operation, the time interval and the minimum operation time, for example from 10 seconds, to take only long executions.

- Go to one of the traces and see what was slowing down there.

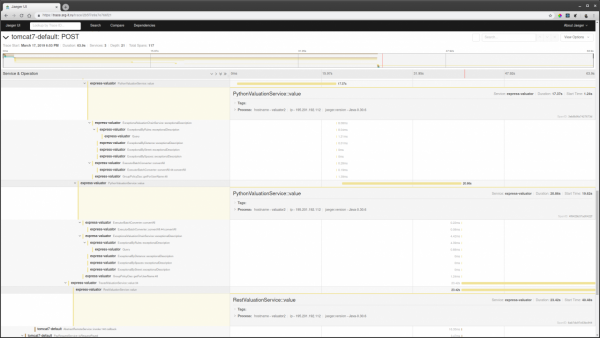
Also, if some request id is known, then you can find a trace by this id through a tag search, if this id is logged in the trace span.
Documentation
- opentracing documentation
- jaeger documentation
- Jaeger java connection
- spring open tracing connection
Articles
- Jaeger Opentracing and Microservices in a real PHP and Golang project
- Evolving Distributed Tracing at Uber Engineering
- Running Jaeger Agent on bare metal
Video
- How We Used Jaeger and Prometheus to Deliver Lightning-Fast User Queries - Bryan Boreham
- Intro: Jaeger - Yuri Shkuro, Uber & Pavol Loffay, Red Hat
- Serghei Iakovlev, “A small story of a big victory: OpenTracing, AWS and Jaeger”
Source: habr.com
