


A common mistake of novice businessmen is that they do not pay due attention to collecting and analyzing data, optimizing workflows and monitoring key indicators. This leads to reduced productivity and a suboptimal waste of time and resources. With bad processes, you have to correct the same errors several times. As the number of customers grows, the service deteriorates, and without data analysis there is no clear understanding of what needs to be improved. As a result, decisions are made on a whim.
To be competitive, modern business, in addition to quality products and services, needs to have transparent processes and collect analytical data. Without this, it is difficult to understand the real state of affairs in business and make the right decisions. Therefore, it is important to have in your arsenal the necessary tools that are not only convenient to use, but also allow you to simplify work and create the most transparent processes.
Today there are a huge number of tools and solutions. But most entrepreneurs don't use them because they either don't see the value in them, or they don't understand how to use them, or they're either expensive or complicated or 100500 more. But those who figured it out, found or created such tools for themselves, have an advantage in the medium term.
For more than 10 years I have been creating IT products and solutions that help businesses increase profits through automation and digital transformation of processes. I have helped build dozens of startups and created dozens of online tools that are used by hundreds of thousands of people around the world.
Here is one of the good examples in my practice showing the benefits of digital transformation. For a small American law firm, my team and I created a legal document generation tool that allowed lawyers to generate documents faster. And later, having expanded the functionality of this tool, we created an online service and completely transformed the company. Now they serve customers not only in their city, but throughout the country. For three years, the company's capitalization has grown several times.
In the article I will share with you the real experience of creating a transparent system for monitoring key business indicators. I will try to instill the value of using digital solutions, I will show that it is not difficult and not always expensive. So let's go!
From what it all began
If you want to have what you never had, you will have to do what you have never done.
Coco Chanel
My wife was tired of being on maternity leave, and we decided to open a small business - a children's playroom. Since I have my own business, my wife takes care of the game room, and I help in strategic issues and development.
The details of opening a business are a completely different story, but at the stage of collecting data and analyzing competitors, in addition to highlighting the specific problems of this business, we paid attention to the problems of internal processes that most competitors did not fight in any way.
To my surprise, in the XNUMXst century, almost no one kept CRM in any form, many kept records in writing, in notebooks. At the same time, the owners themselves complained that employees steal, make mistakes in calculations, and they have to spend a lot of time to recalculate and compare with entries in the ledger, data on reservations, deposits are lost, customers leave for reasons they do not understand.
Analyzing the collected data, we realized that we do not want to repeat their mistakes and we need a transparent system that will minimize these risks. First of all, we began to look for ready-made solutions, but we could not find fully satisfying our requirements. And then I decided to make my own system, albeit not ideal, but working and inexpensive (almost free).
When choosing a tool, I took into account the following criteria: it should be inexpensive, it should be flexible and accessible, and it should be easy to use. I could write a complete, powerful and expensive system for this business, but we had little time and a small budget, plus we did not fully understand whether our project would work, and it would be unwise to spend a lot of resources on this system. Therefore, at the time of testing the hypothesis, I decided to start with MVP (Minimum Viable Product - minimum viable product) and in the shortest possible time with minimal investment make a working version, and eventually finish or redo it.
As a result, my choice fell on Google services (Drive, Sheets, Calendar). The main source of input-output information is Google Sheets, since my wife has experience with spreadsheets, she can make changes on her own if necessary. I also took into account the fact that employees who may not be very good at using a computer will also use the tool, and teaching them to enter data into a table will be much easier than teaching them how to work with some specialized program like 1C.
The data entered into the tables changes in real time, that is, at any time you can see the situation of the company, security is built in, you can restrict access to certain people.
Development of architecture and data structure
The children's playroom provides several basic services.
- Standard visit - when a customer buys time spent in their children's playroom.
- Supervised visit - when a client buys time spent in the playroom of their children and pays extra for supervision. That is, the client can leave the child and go about his business, and the room worker will watch and play with the child during the absence of the parent.
- outdoor birthday – the client rents a separate table for eating and accommodating guests and pays for a standard visit to the game room, while the room operates as usual.
- Closed birthday – the client rents the entire premises, the room does not accept other clients during the rental period.
It is important for the owner to know how many people visited the room, how old they were, how much time they spent, how much money they earned, how much they spent (it often happens that the administrator needs to buy something or pay for something, for example, delivery or water), how many birthdays.
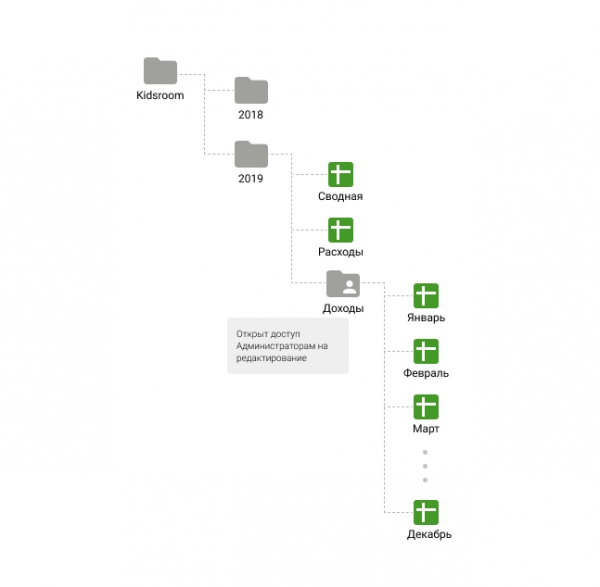
Like any IT project, I started by thinking through the architecture of the future system and working out the data structure. Since the spouse is engaged in business, she knows everything that she needs to see, control and rule, so she acted as a customer. Together we held a brainstorm and drew up requirements for the system, on the basis of which I thought out the functionality of the system and formed the following structure of files and folders in Google Drive:
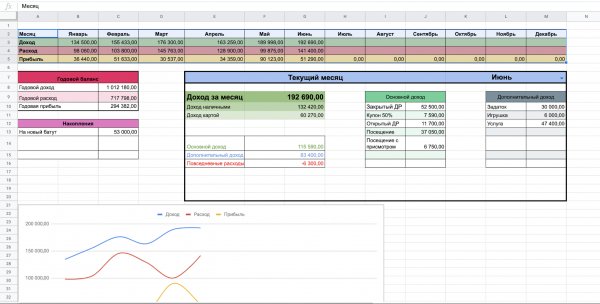
The "Summary" document contains general information on the company: income, expenses, analytics
The document "Expenses" contains information on the monthly expenses of the company. For greater transparency, it is broken down into categories: office expenses, taxes, personnel expenses, advertising expenses, other expenses.
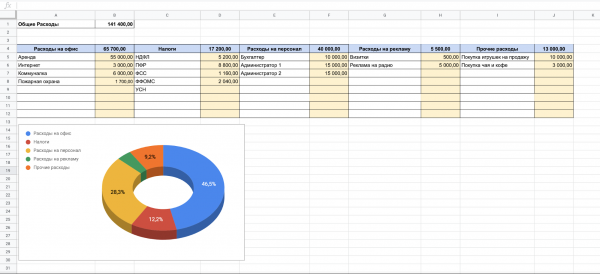
monthly expenses
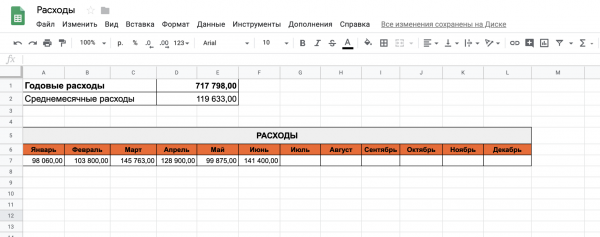
Summary table of expenses for the year
There are 12 Google Sheets in the Income folder, one for each month. These are the main working documents that employees fill out daily. They contain the obligatory dashboard tab and tabs for each working day. The dashboard tab displays all the necessary information for the current month for a quick understanding of business, and it is also possible to set prices and add services.
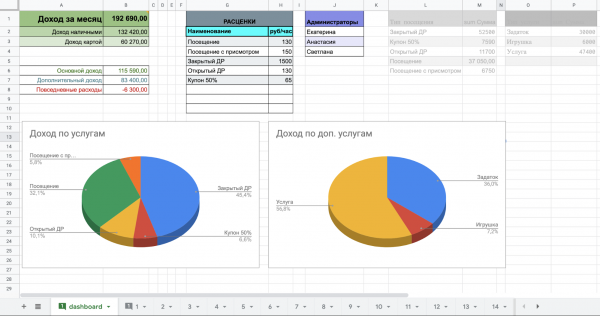
dashboard tab
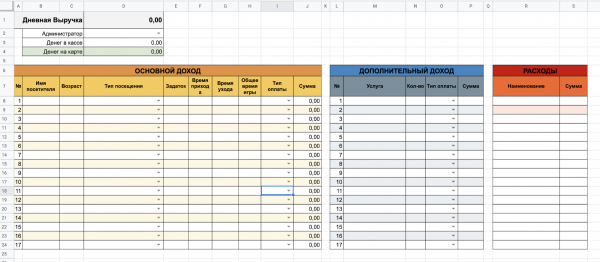
daily tab
In the process of business development, additional needs began to appear in the form of discounts, subscriptions, additional services, and events. We also implemented all this over time, but this example shows the basic version of the system.
Creation of functionality
After I figured out the main indicators, worked out the architecture and data exchange between entities, I started implementation. First of all, in the "Income" folder, I created a Google Sheet document. I created two tabs in it: dashboard and the first day of the month, in which I added the following table.
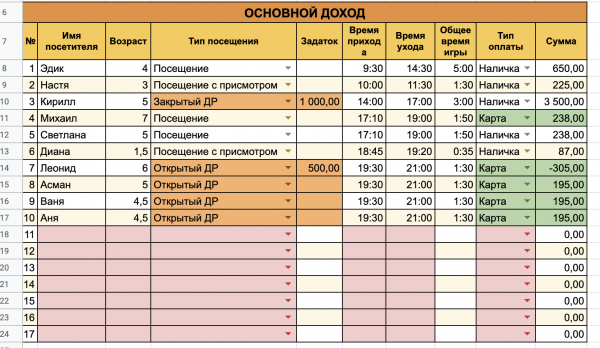
Main worksheet
This is the main worksheet that the Administrator will work with. He just needs to fill in the required fields (marked in red), and the system will independently calculate all the necessary indicators.
To reduce input errors and convenience, the "Type of visit" field was implemented by a drop-down list of the services provided, which we can edit on the dashboard page. To do this, we add data validation to these cells and indicate the range from where to get the data.
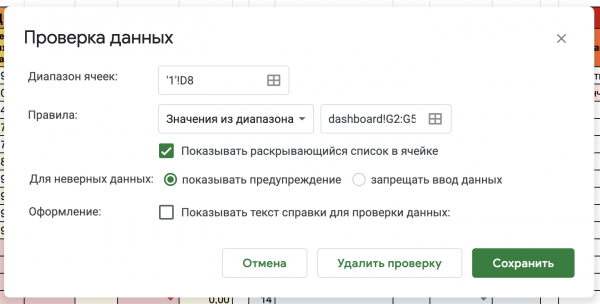
To reduce human error in calculations, I have added an automatic calculation of the hours spent by the client in the room and the calculation of the amount of money payable.
To do this, the Administrator must simply record the time of arrival of the client (column E) and the time of departure (column F) in the format HH:MM. To calculate the total time spent by a client in the game room, I use this formula:
=IF(ISBLANK($F8); ""; $F8-$E8)To automatically calculate the amount of money for using the services, I had to use a more complex formula, since the price of an hour can vary depending on the type of service. Therefore, I had to link data to the services table on the dashboard page using the QUERY function:
=ROUNDDOWN(G4*24*IFERROR(QUERY(dashboard!$G$2:$H$5; "Select H where G = '"& $D4 & "'");0)In addition to the main actions, I added additional functions to eliminate unwanted IFERROR or ISBLANK errors, as well as the ROUNDDOWN function - in order not to mess around with trifles, I rounded the final amount down, towards the client.
In addition to the main income (time rent), the children's playroom has additional income in the form of services or the sale of toys, and employees make some small expenses, for example, pay for drinking water or buy sweets for compliments, all this must also be taken into account.
Therefore, I added two more plates, in which we will record this data:
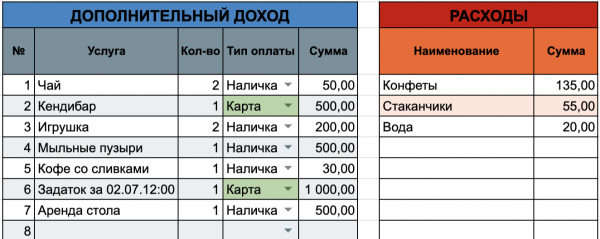
To make it easier to work with the signs, I colored them and added conditional cell formatting.
The main tables are ready, now you need to bring the main indicators into a separate table, so that you can clearly see how much you earned in a day and how much of this money is in the cash register and which is on the map.
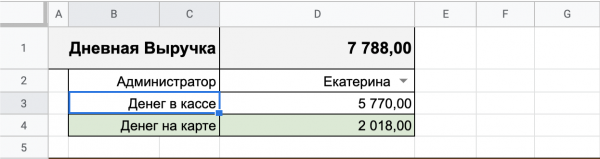
For the total count of money by type of payment, I again used the QUERY function:
=QUERY(I8:J;"SELECT sum(J) WHERE I='Наличка'"» и «=QUERY(I8:J;"SELECT sum(J) WHERE I='Карта'")At the end of the working day, the administrator only needs to double-check the revenue and not deal with the recalculation manually. We do not force a person to do additional work, and the owner can see and control the situation at any time.
All the necessary tables are ready, now we just duplicate the tab for each day, number it and get the following.

Great! Almost everything is ready, it remains to display all the main indicators for the month on the dashboard tab.
To get the total amount of income for the month, you can write the following formula
='1'!D1+'2'!D1+'3'!D1+'4'!D1+'5'!D1+'6'!D1+'7'!D1+'8'!D1+'9'!D1+'10'!D1+'11'!D1+
'12'!D1+'13'!D1+'14'!D1+'15'!D1+'16'!D1+'17'!D1+'18'!D1+'19'!D1+'20'!D1+'21'!D1+
'22'!D1+'23'!D1+'24'!D1+'25'!D1+'26'!D1+'27'!D1+'28'!D1+'29'!D1+'30'!D1+'31'!D1
where D1 is the cell with daily revenue and '1', '2' and so on is the name of the tab. In exactly the same way, I get data on additional income and expenses.
For clarity, I decided to display the total profitability by category. To do this, I had to make a complex selection and grouping from all the tabs, and then filter and remove empty and unnecessary lines.
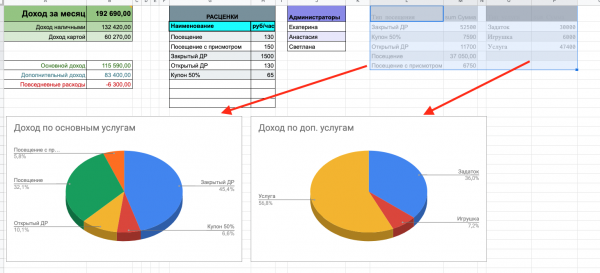
Profitability by category
The main income accounting tool is ready, now let's just duplicate the file for each month of the year.
After I created a tool for accounting and controlling income, I set about creating an expense table in which we will take into account all monthly expenses: rent, payroll, taxes, purchase of goods and other expenses.
In the folder of the current year, I created a Google Sheet document and added 13 tabs, a dashboard and twelve months to it.
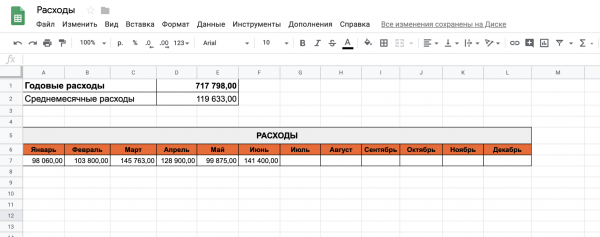
dashboard tab
For clarity, in the dashboard tab, I summarized all the necessary information on financial expenses for the year.
And in each tab of the month, I created a table in which we will keep all the expenses of the company's funds by category.
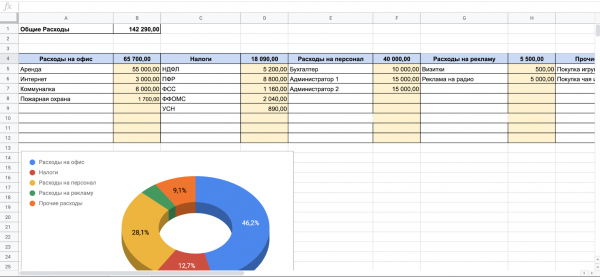
Month tab
It turned out very convenient, now you can see and control all the expenses of the company, and if necessary, see the history and even make analytics.
Since information on income and expenses is located in different files and it is not very convenient to monitor it, I decided to create one file in which I summarized all the relevant information necessary for the owner to control and manage the company. I named this file "Summary".
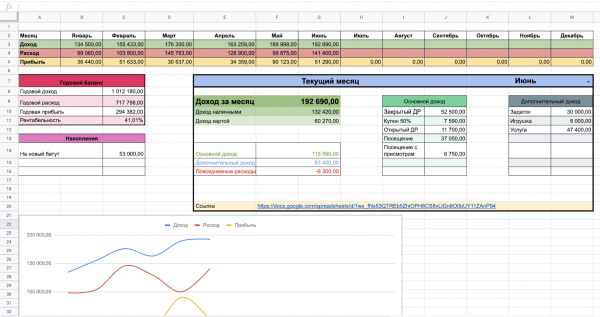
summary table
In this file, I created a table that receives monthly data from tables, for this I used the standard function:
=IMPORTRANGE("url";"dashboard!$B$1")where I pass the document ID as the first argument, and the imported range as the second argument.
Then he brought the annual balance sheet: how much was earned, how much was spent, what profit, profitability. Visualize the required data.
And for convenience, so that the business owner can see all the data in one place and not run through the files, I have integrated the ability to select any month of the year and display the main indicators in real time.
To do this, I created a bunch of month and document ID

Then I created a drop-down list using "Data -> Data Validation", specified the range of the link and set up import with a dynamic link to the document
=IMPORTRANGE("'"& QUERY(O2:P13;"SELECT P WHERE O ='"& K7 &"'") &"'"; "dashboard!$A1:$B8")Conclusion
As you can see, improving the processes in your business is not as difficult as it might seem, and for this you do not need to have any super skills. Of course, this system has a lot of drawbacks, and it will be impossible to use it with the growth of the business, but for a small business or at the start when testing a hypothesis, this is an excellent solution.
This game room has been working on this solution for the third year, and only this year, when we already clearly understand all the processes, we know our client and the market. We decided to create a complete online business management tool.
P.S.
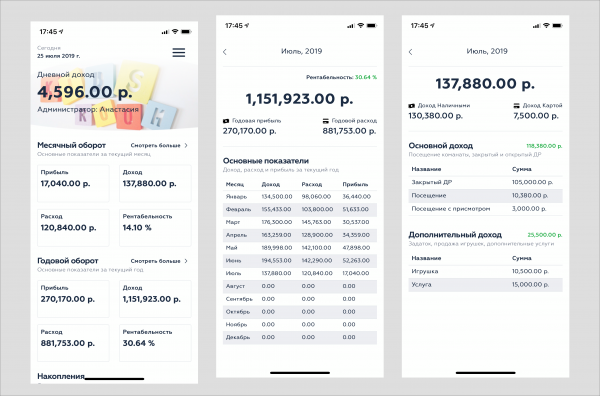
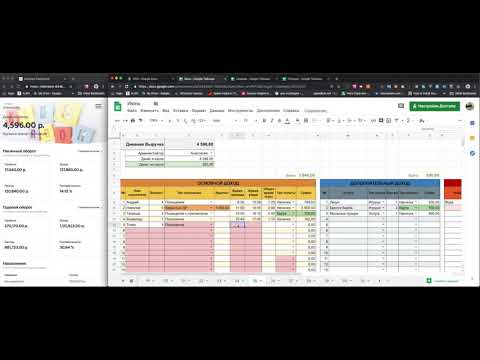
It is not very convenient to use Google Sheets to monitor a business, especially from a phone. So I did , which displays in real time all the main business indicators in a convenient format

Source: habr.com

